What Makes Your Site Fast? (Lighthouse Performance Scoring)
Web
9 Min-Read
My site was slow and ugly!
@Author
This site?
@Reader
Yep, back when I was just starting out – it was painfully slow … we’re talking dial-up era slow! It took about 5-10 seconds per page load. 💀
Downright embarrassing!
It didn’t take too much falling down the YouTube rabbit hole to figure out what the issue was. It was me!
Well, I was lazy. Got myself some cheap ass hosting and slapped a WordPress site. Like most beginners, I just did what was easiest at the time.
Page builders, lots of plugins, third-party junk and to top it off … some random paid tools. I fed my site too much fat and it was running slow cause it gained weight.
By the time I achieved a 97 PSI score, there were still several things I had to iron out. The key takeaway is that there is no such thing as ‘enough’.
So, I hired an expert to look at the things I missed. (I’ll tell you more about it below).
What Makes Your Site Fast?
I’ll keep this simple.
Avoid Crappy Hosting (Use Litespeed Server)
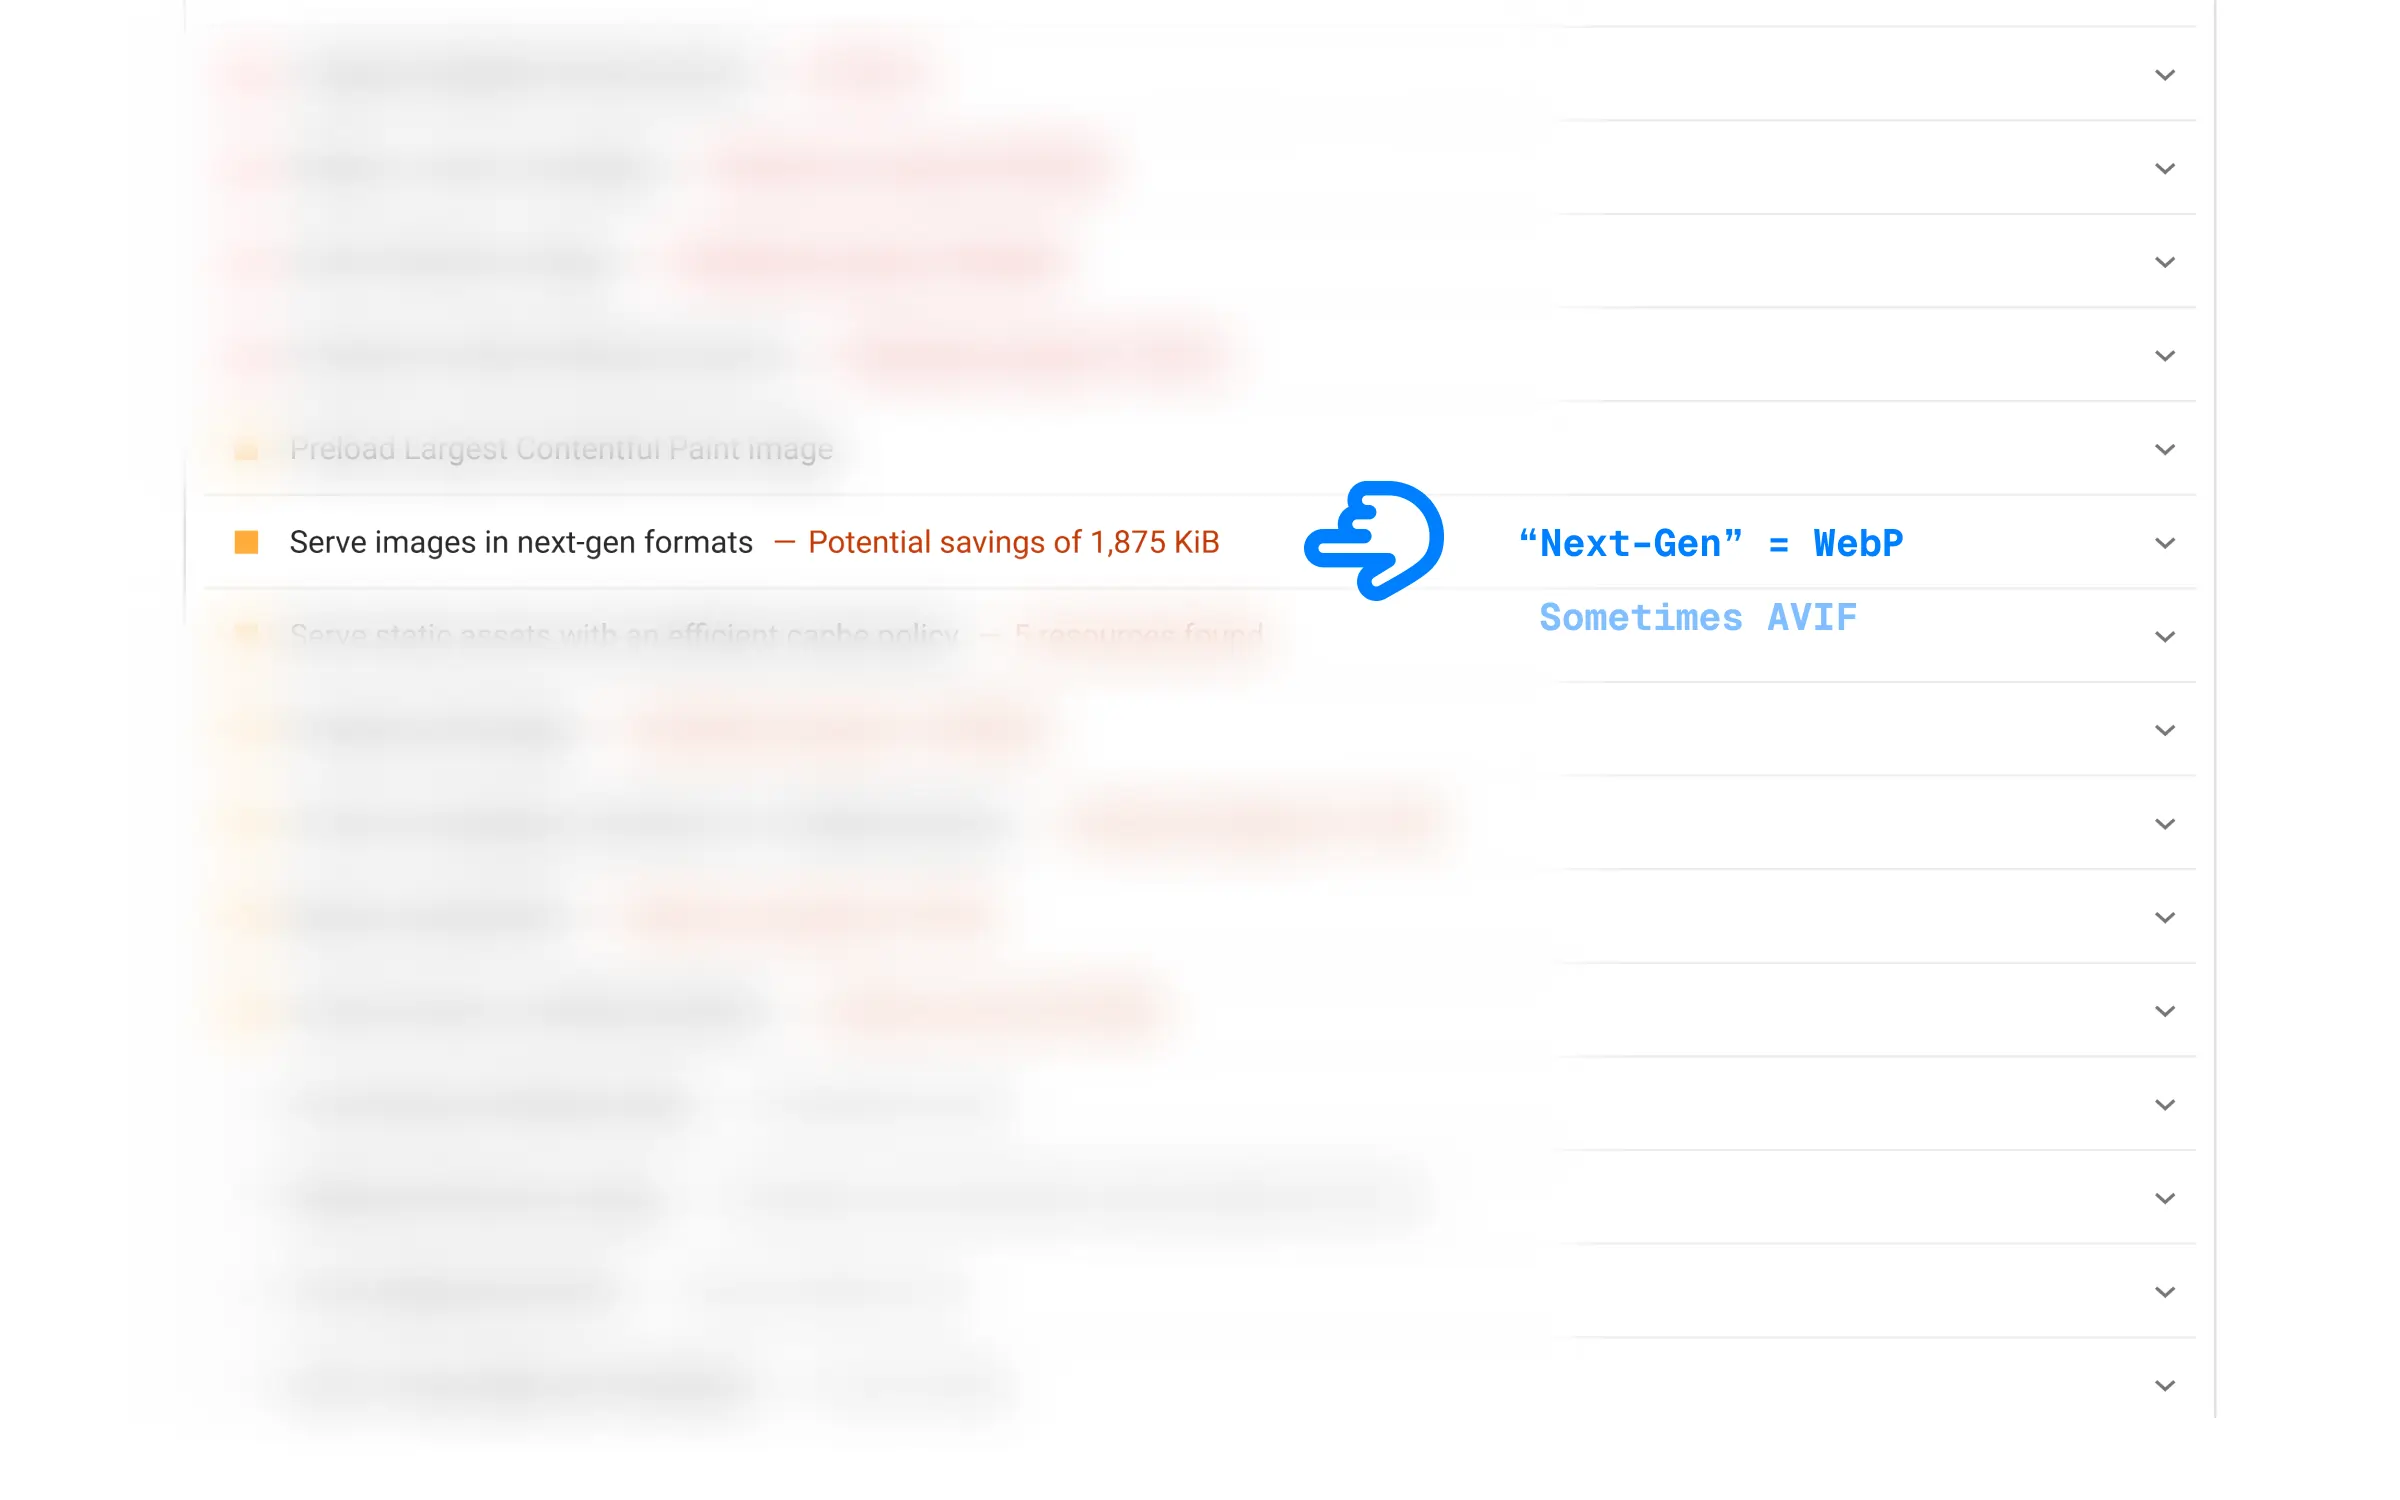
Your Images Suck Big Time
Remove All Plugins (Okay May Be Not All)
Clean Up and Minify Code/JavaScript
Use a CDN (Caching Matters)
Self-host Fonts (Don’t Use Google Fonts)
Lazy load and Pre-load Resources
Avoid Crappy Hosting
One of my biggest early mistakes was definitely signing up with HostGator. They were so bad. (Main reason for my slow loading time).
Most posts/videos online won’t tell you that though cause they are misleading affiliates with fake “best hosting” reviews. What can I say, honesty doesn’t always pay the bills.
Here are some hosting companies that I would avoid entirely:
Here is what to look for when choosing your hosting service:
Lite Speed and NVMe
24X7 Support vs “Blamesell”
Server Location and CDN
Unlimited Bandwidth?
Lite Speed and NVMe
Your host’s server is basically just another computer, too. The main difference is that it’s running specialized webserver software. (Instead of Windows, macOS or Linux).
Now Apache is probably one of the oldest and most widely used ones, but I’ve also seen Nginx.
I wouldn’t waste my time with both of these though, Litespeed is literally built from ground up for speed and performance.
To be honest, about 40% or more of the speed gains came from switching to a better web host.
@Author
And why NVMe?
@Reader
Just look at the numbers …
Feature
HDD and SSDs
NVMes
Interface
SATA (III)
PCIe 4.0
Protocol
AHCI
NVMe
Max Speed
6 Gbps
Up to 32 Gbps
Read Speed
~550 MB/s
~7,000+ MB/s
Write Speed
~520 MB/s
~7,000+ MB/s
Read IOPS
~80 – 100K
1 Million+
Write IOPS
~30 – 50K
1 Million+
Latency
~6 Microsec
~2.8 Microsec
Command Queues
1 (Just One)
Up to 64K
NVMe offers roughly 10x – 13x faster read and write speeds (and 53% lower latency) compared to SATA.
Hosting companies like NameHero, ChemiCloud and Hostinger all have NVMe drives.
24X7 Support
A very common thing I noticed with bad hosting was a phenomenon I call the “blamesell” game. (Blame + Upsell)
Almost makes you feel like you’re getting played!
A very simple way to detect blamesell is:
The support chat is not available 24X7.
They’ll blame anything but themselves when things slow down.
They immediately push you to upgrade.
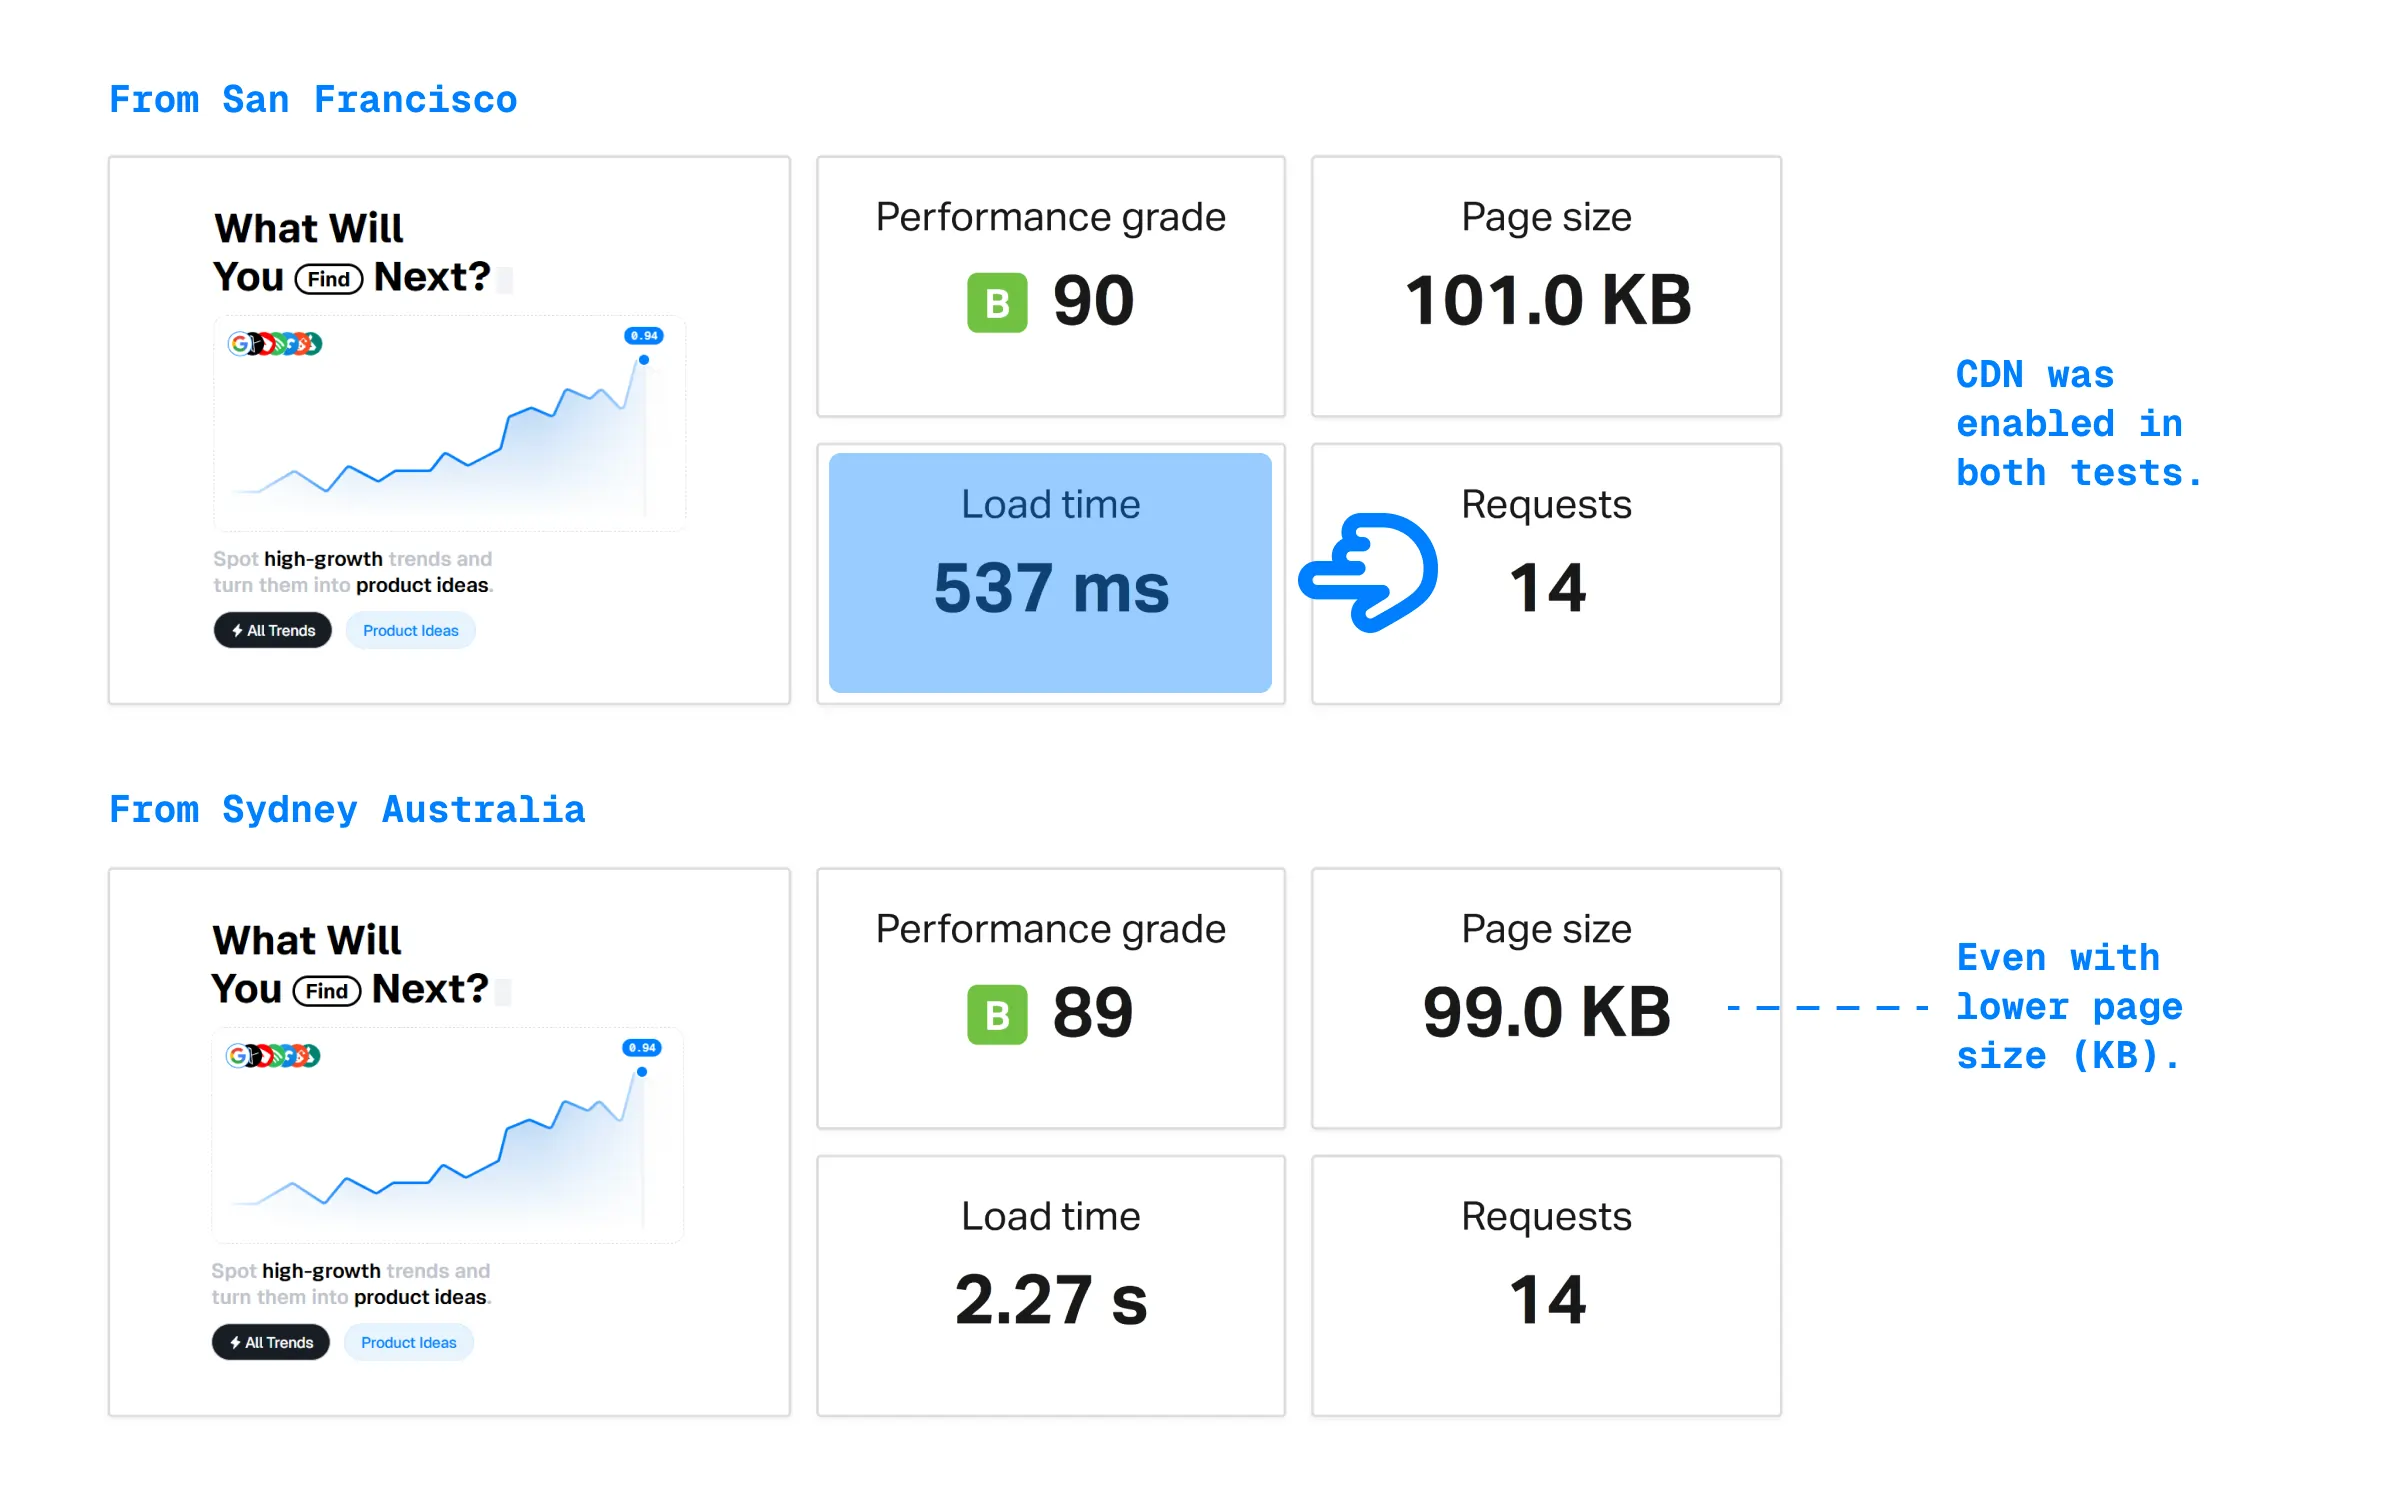
Server Location and CDN
CDNs help but they don’t replace the need for having servers geographically close to your primary audience which reduces latency/delay.
CDNs build upon that foundation.
@Author
How do I know where th …
@Reader
Again Google: “[Host name] + Server Locations”.
Most hosting companies will let you choose which datacenter to use on initial setup. (Or you can request it).
Unlimited Bandwidth?
“Unlimited Bandwidth“ It’s a marketing term designed to sound appealing, there’s really no such thing.
I wouldn’t use those unless you have a very specific reason.
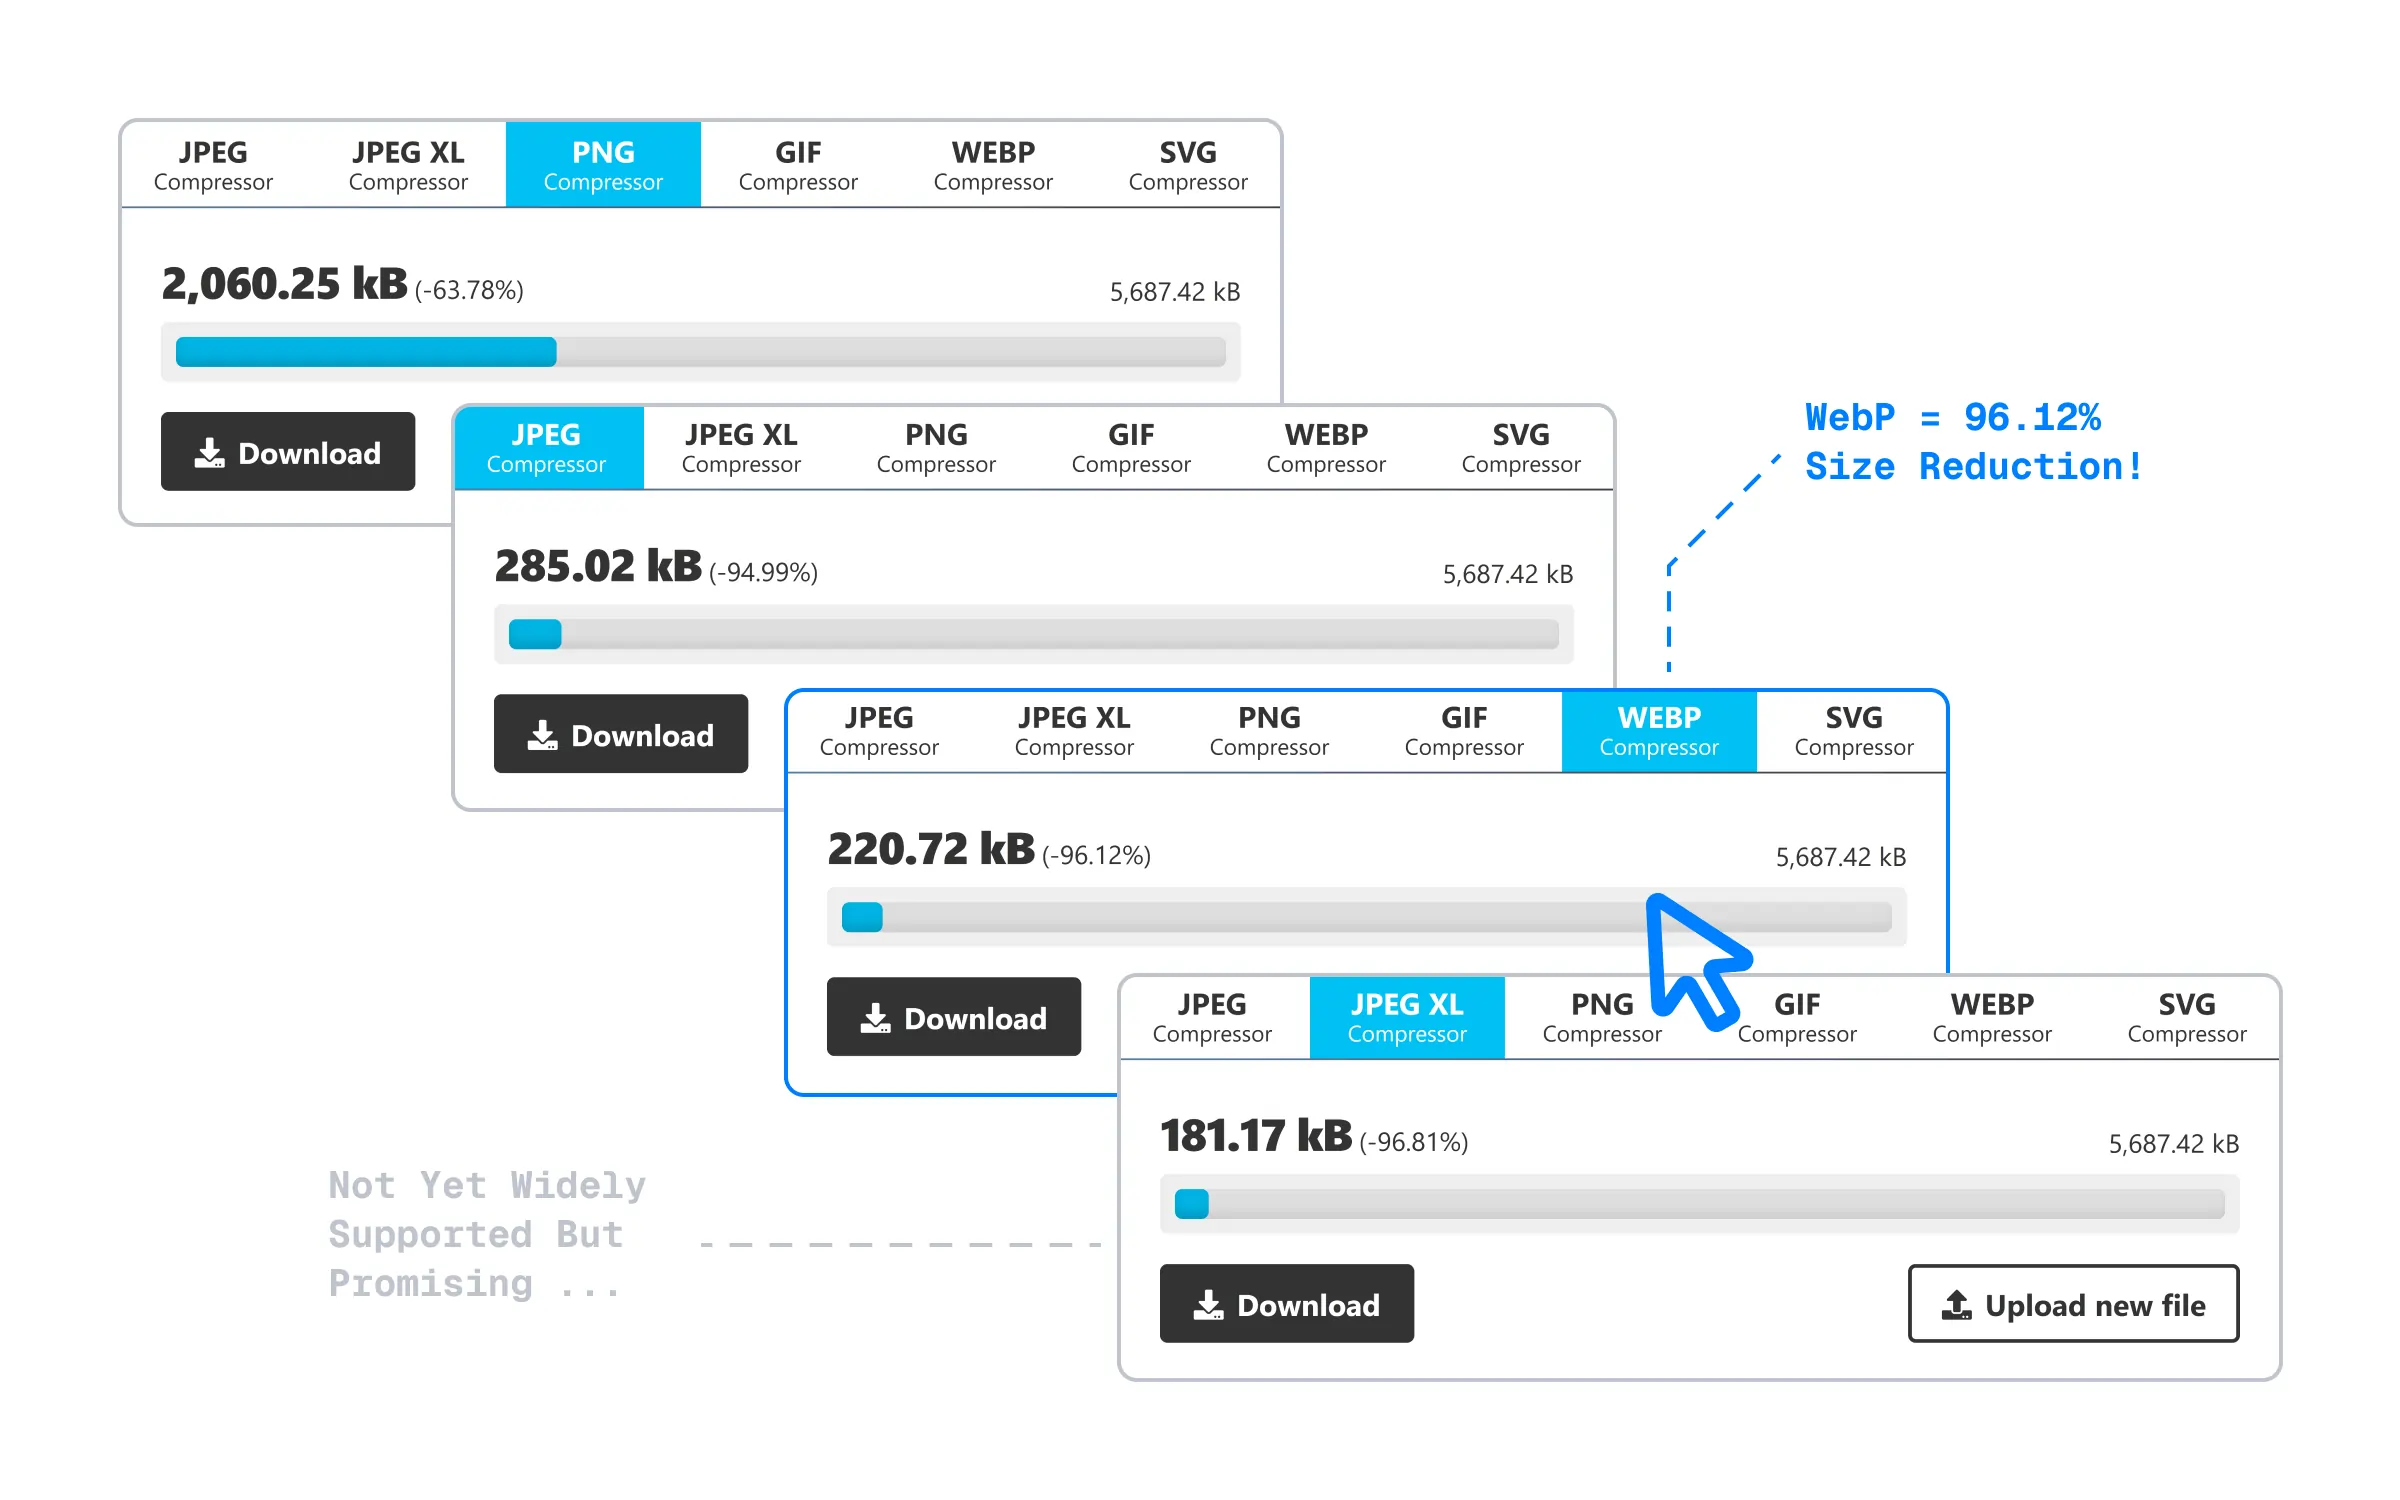
I tested it with the same image using Compress-Or-Die.
WebP generally offers 20-50% smaller file sizes for a comparable visual quality.
Pretty Cool!
@Reader
Remove All Unneeded Plugins
This one is for WordPress users exclusively.
Here is a list of plugins I would Instantly Remove:
Akimset Anti–Spam
Jetpack
Contact Form 7
Monster Insights
Yoast SEO
Hello Dolly
WP Bakery
Wordfence
My experience with these plugins has been quite frustrating. (Also, a moment of silence for those still using page builders).
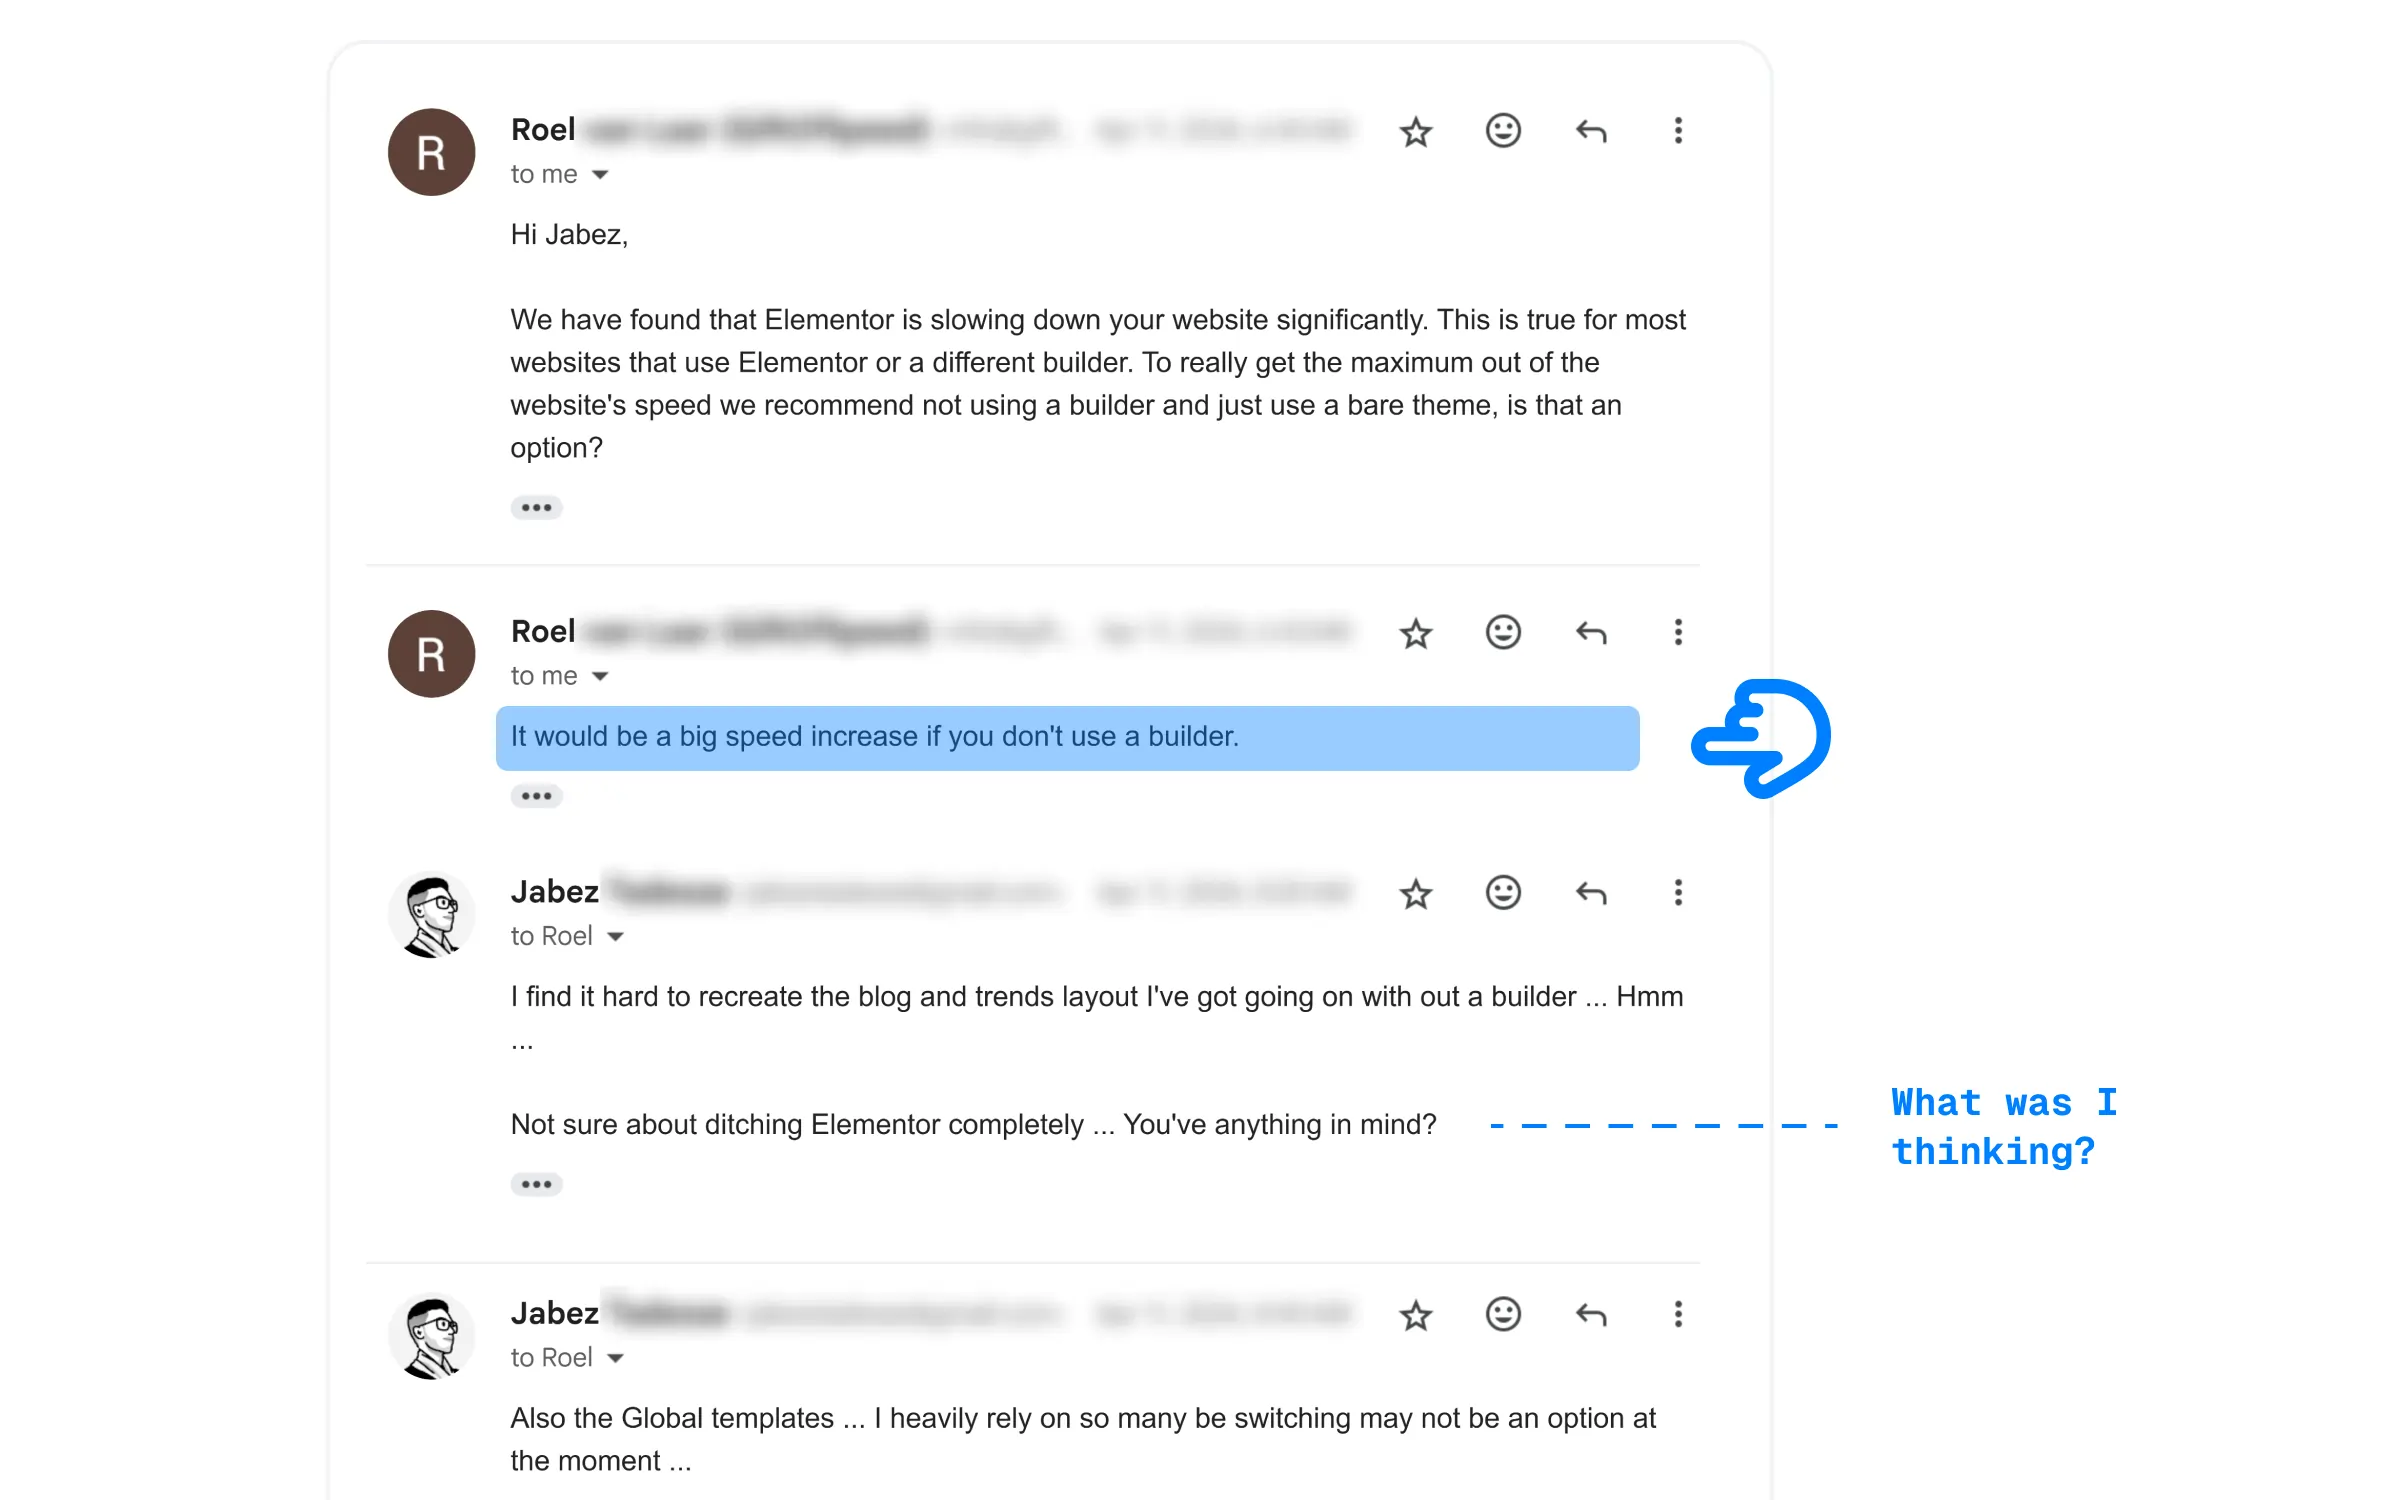
Roel, from Giftofspeed basically looked at my site and was like “Dude, Elementor is killing your speed“. That was the first thing he pointed out! He suggested ditching the builder altogether.
But I resisted.
Even with all his tricks, Elementor was going to be a major roadblock. Apparently, that’s just how it goes with most builders. (Look at what he found).
We tried pushing forward with Elementor anyway.
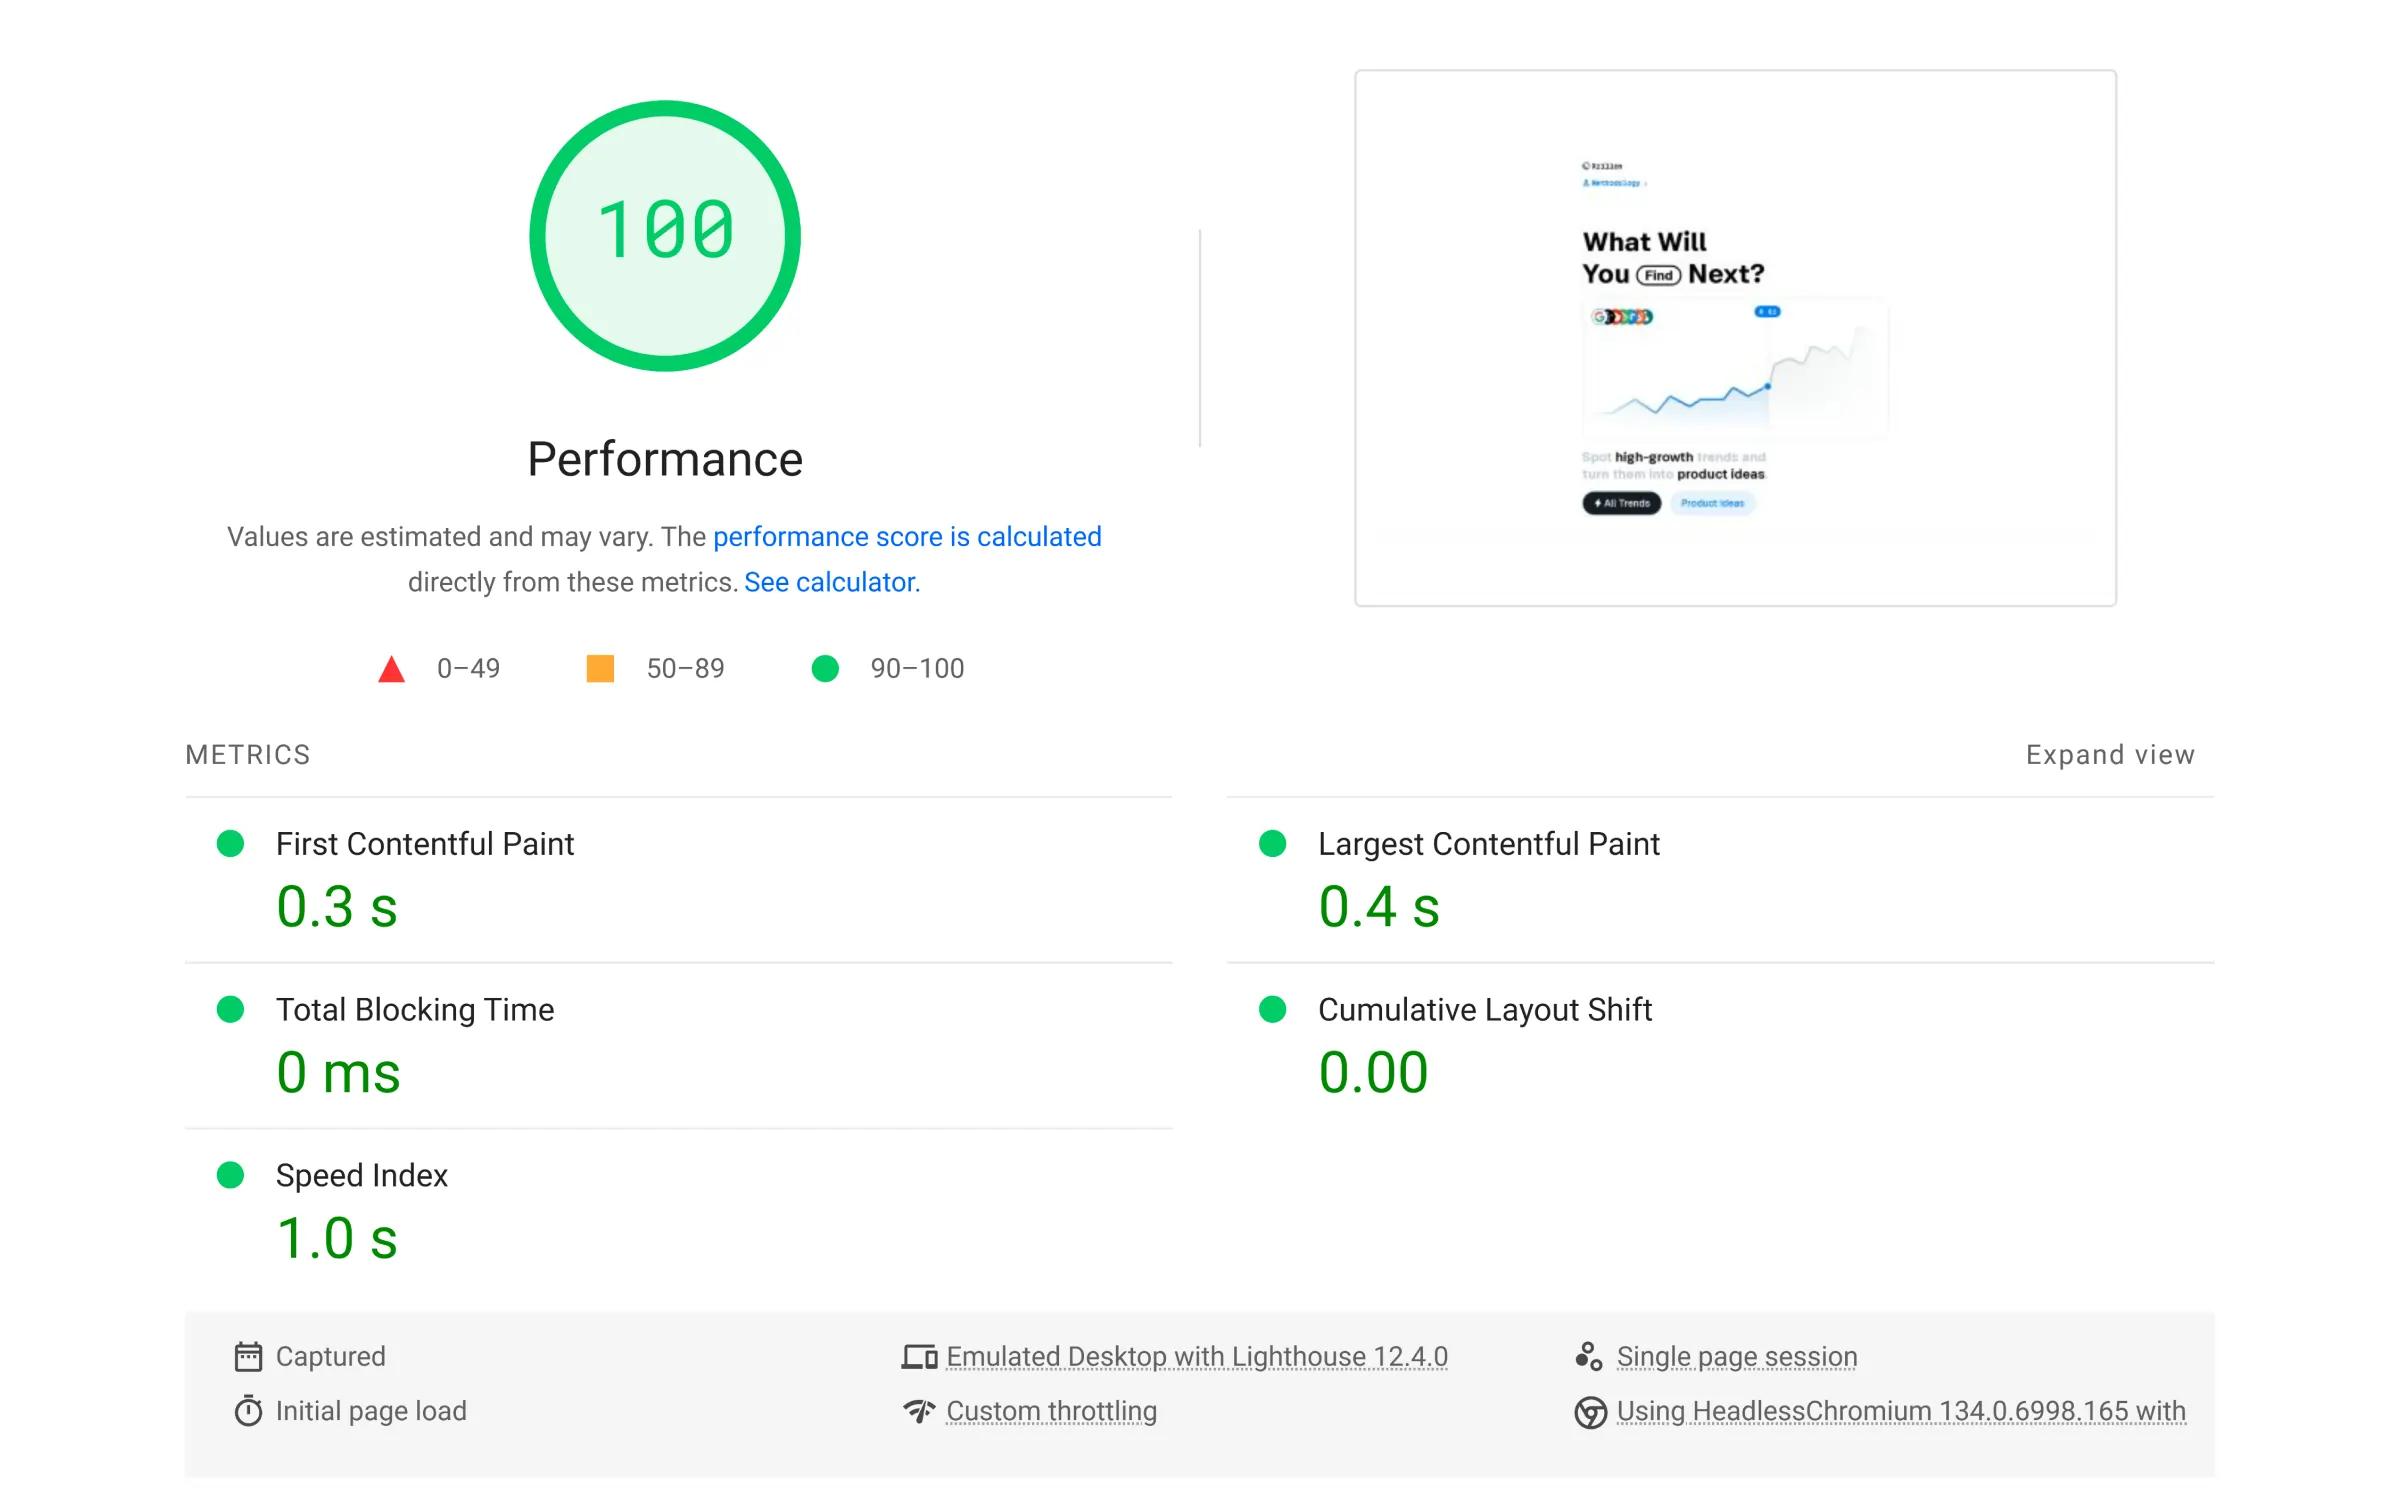
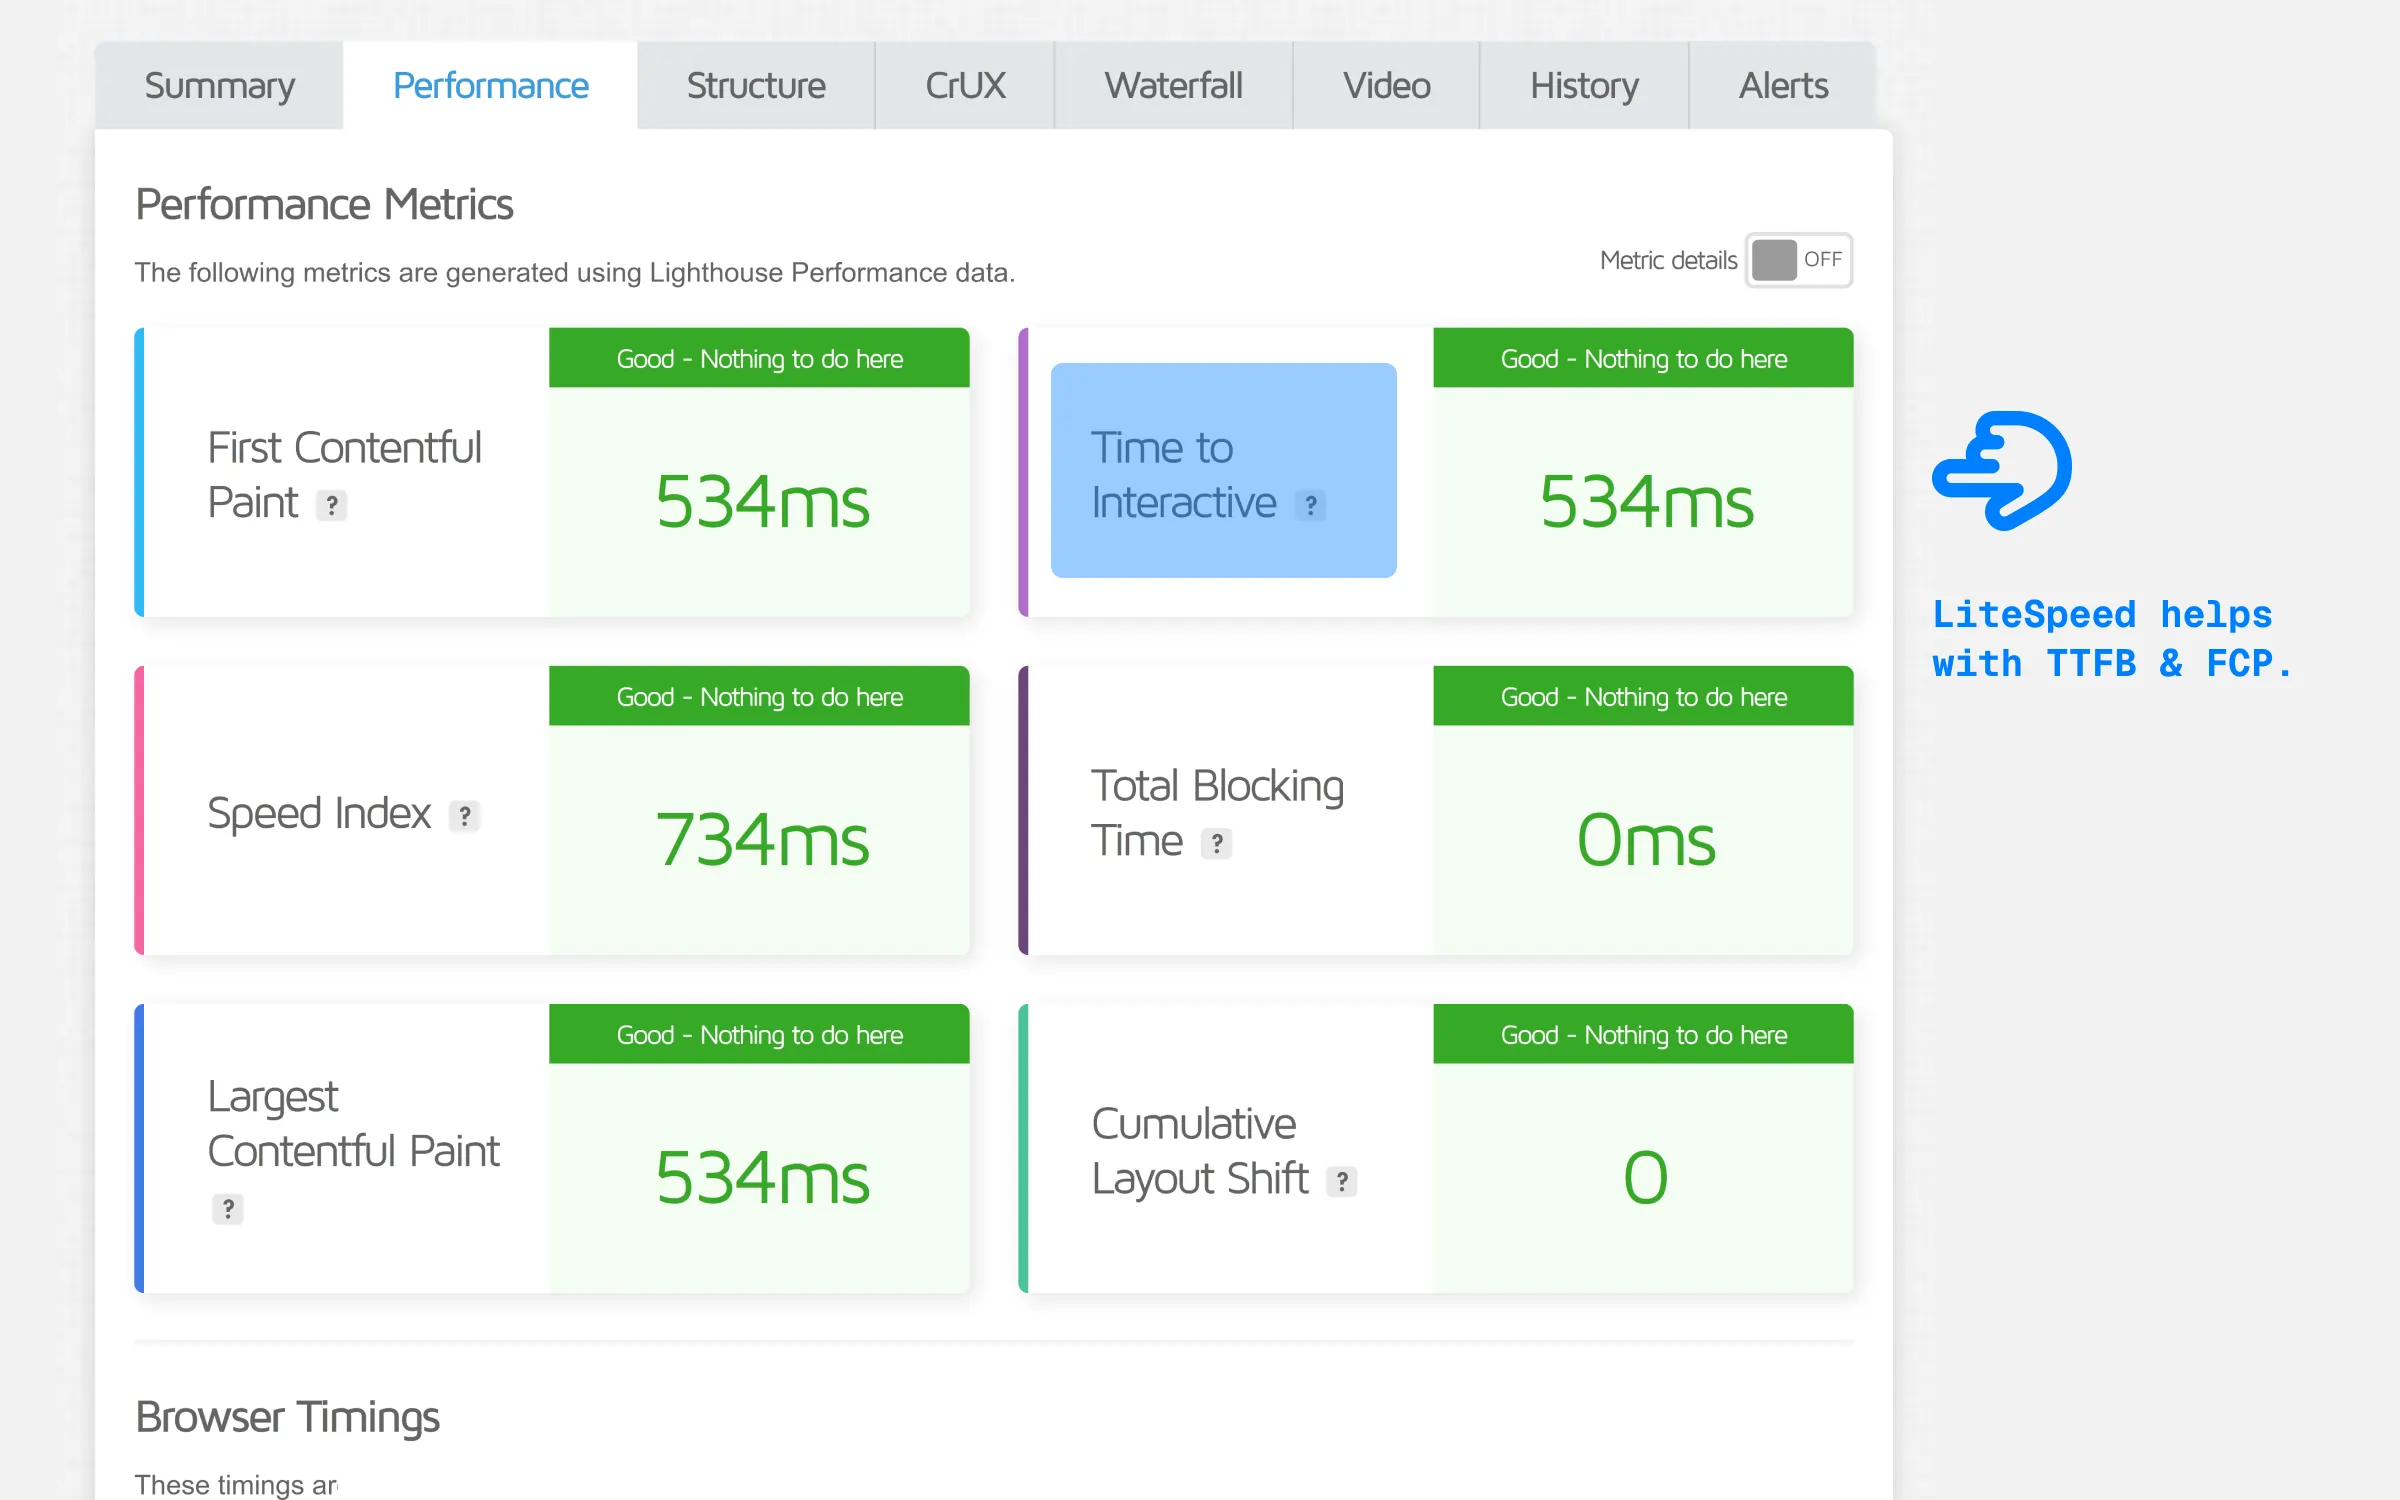
Roel worked his magic and somehow managed to get the speed to 95-97 PSI score. (But Elementor updates seem to mess up his work a bit, it needed to go)!
Here is the history in comparison.
(My optimizations):
Metric
Before
After
Page Speed
41
78
FCP
4.2s
2.0s
LCP
7.4s
2.2s
Blocking Time
4s
1.2s
CLS
0.30
0.00
Speed Index
4.0s
2.0s
(Roel’s optimizations):
Metric
Before
After
Page Speed
78
97
FCP
2.0s
1.1s
LCP
2.2s
0.7s
Blocking Time
1.2s
0.0s
CLS
0.00
0.00
Speed Index
2.0s
1.0s
(After removing Elementor and jQuery):
Metric
Before
After
Page Speed
97
100
FCP
1.1s
0.3s
LCP
0.7s
0.2s
Blocking Time
0.0s
0.0s
CLS
0.00
0.00
Speed Index
1.0s
1.0s
Now we taukin!
Clean Up and Minify Code
Minification reduces the size of your code by removing unnecessary characters.
I don’t really like minifying code directly through a plugin tough.
Toptal’s tools are my go-to for minifying JavaScript and CSS
@Author
Doesn’t that make the code hard to edit in the future though?
@Reader
keep your original code tucked away as a backup (make the changes there) but use the minified version on your live site.
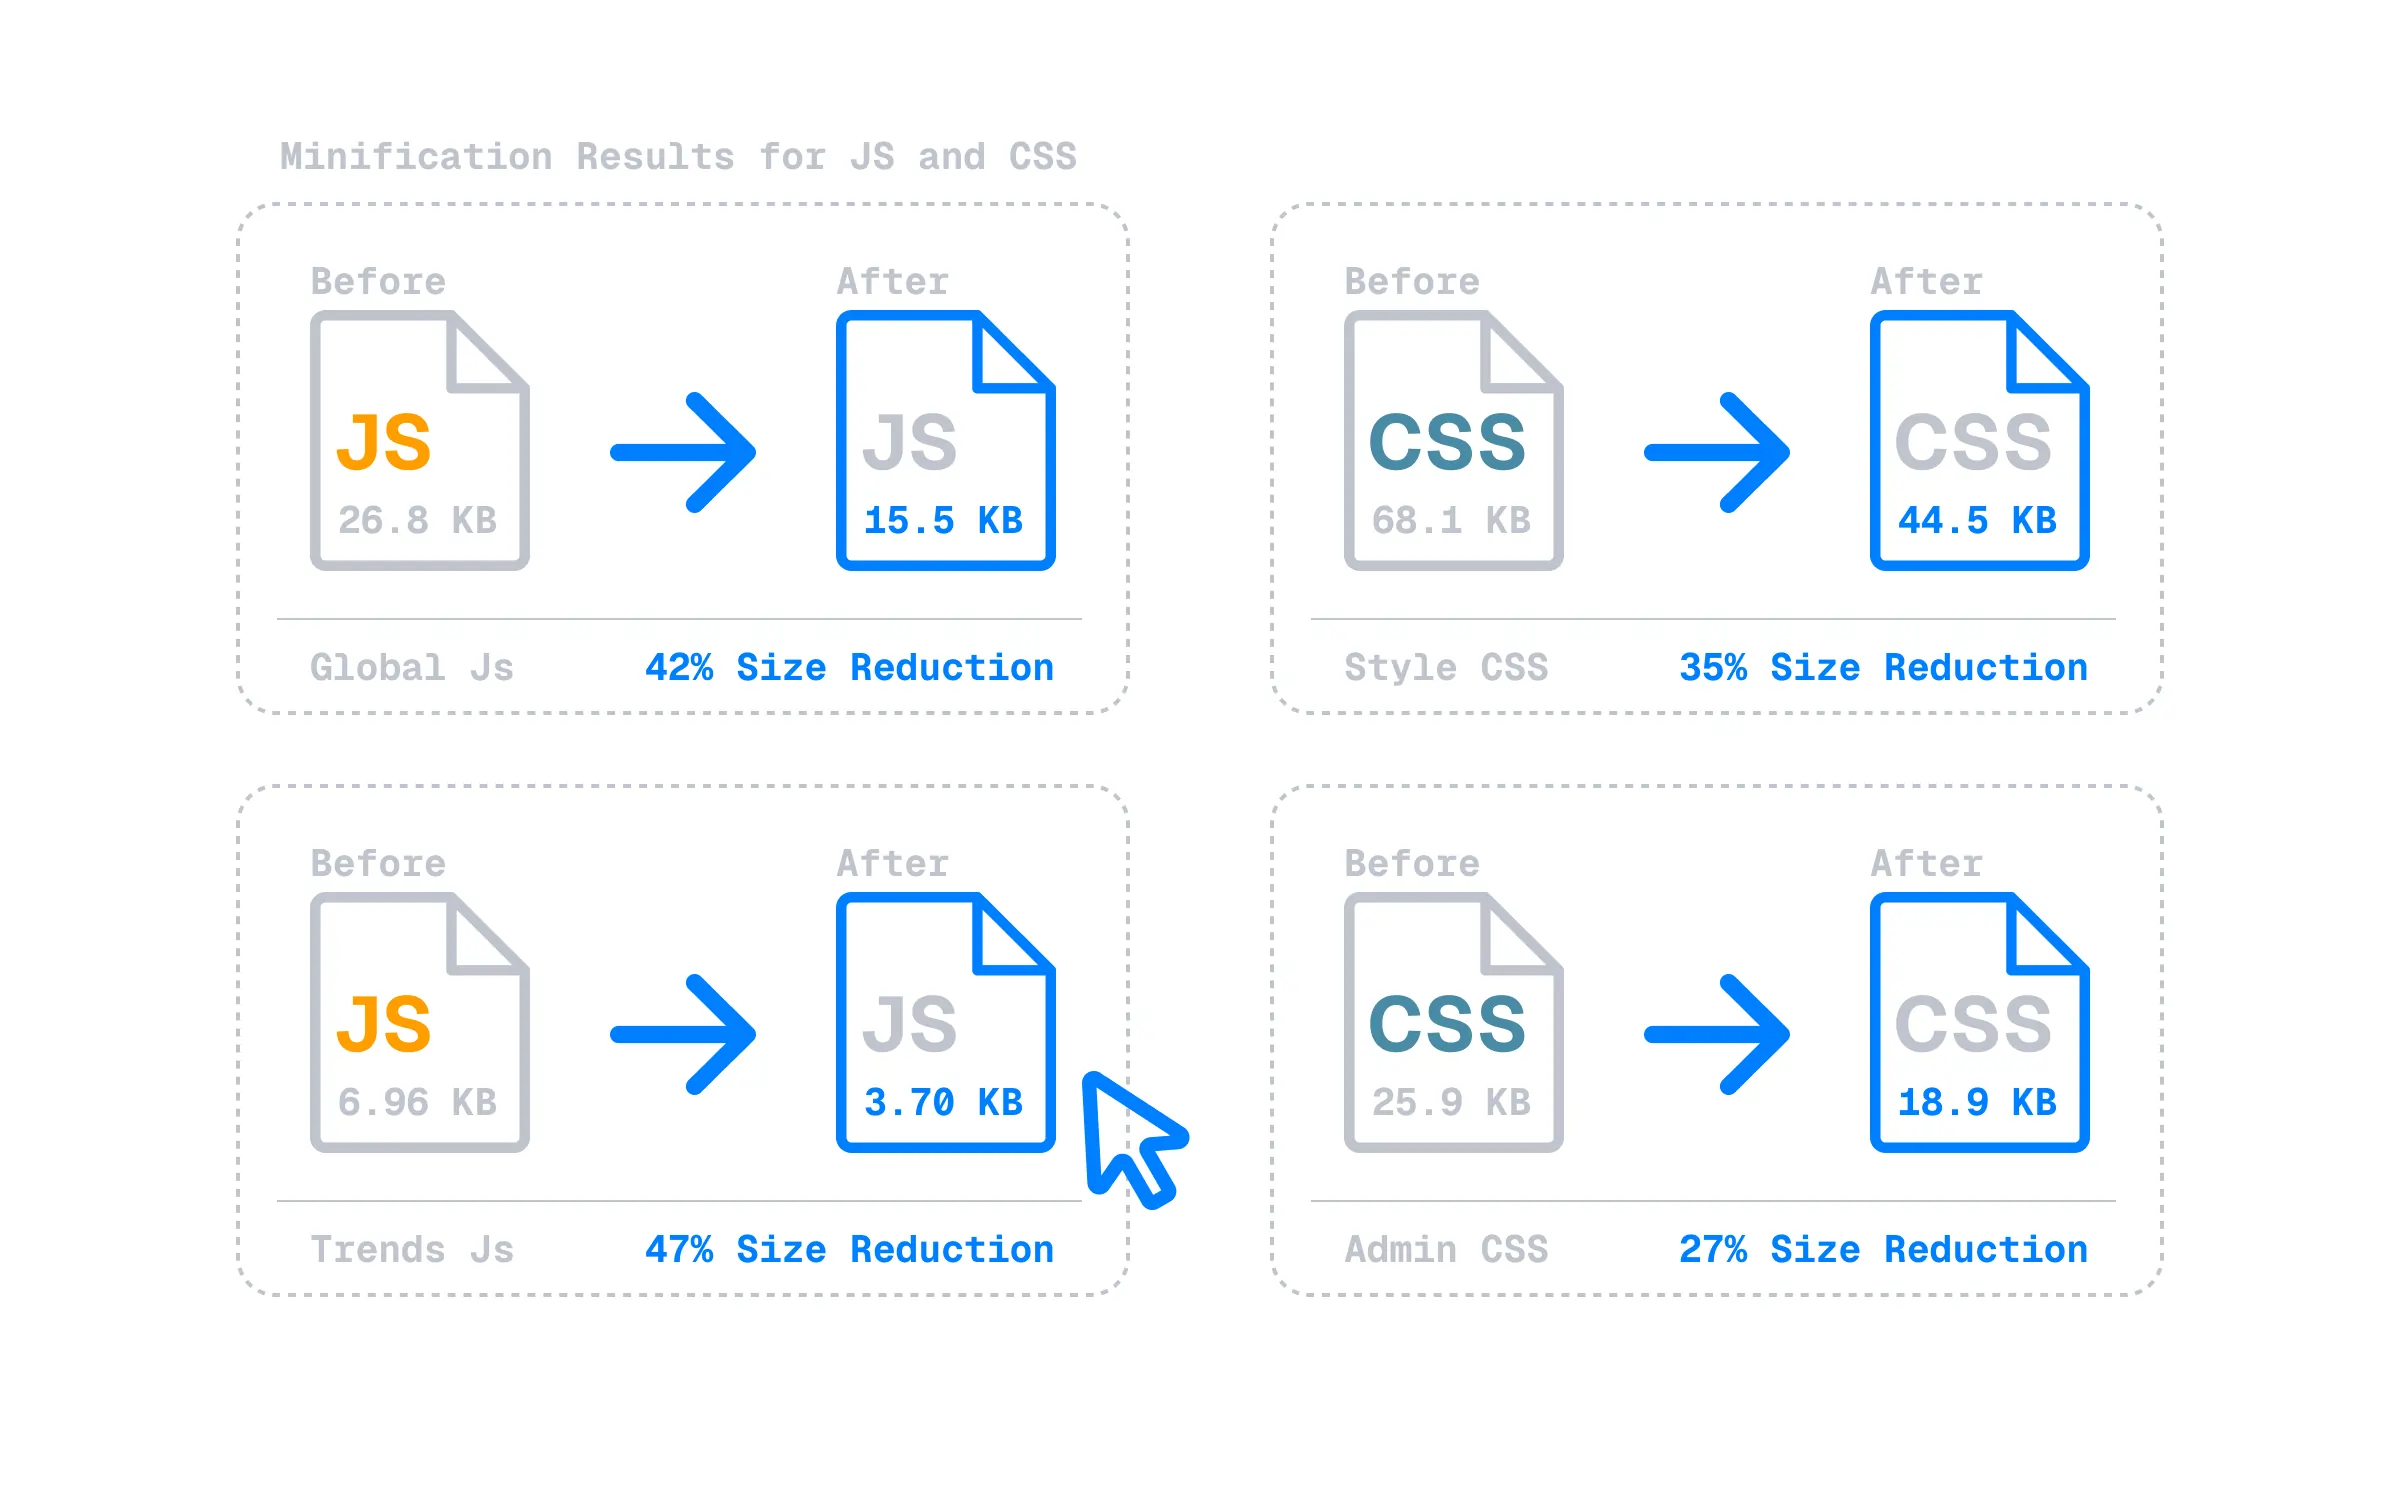
Check out the size difference I was able to get before and after minification:
A 38% reduction in file size on average.
That across all your code is massive.
Use a CDN (Caching Matters)
CDNs spread copies of your site on servers all over the world.
Since I’m using LiteSpeed, QUIC.Cloud CDN works best for me.
If you’re not on LiteSpeed? Cloudflare’s usually the Go-To.
And now for the steps.
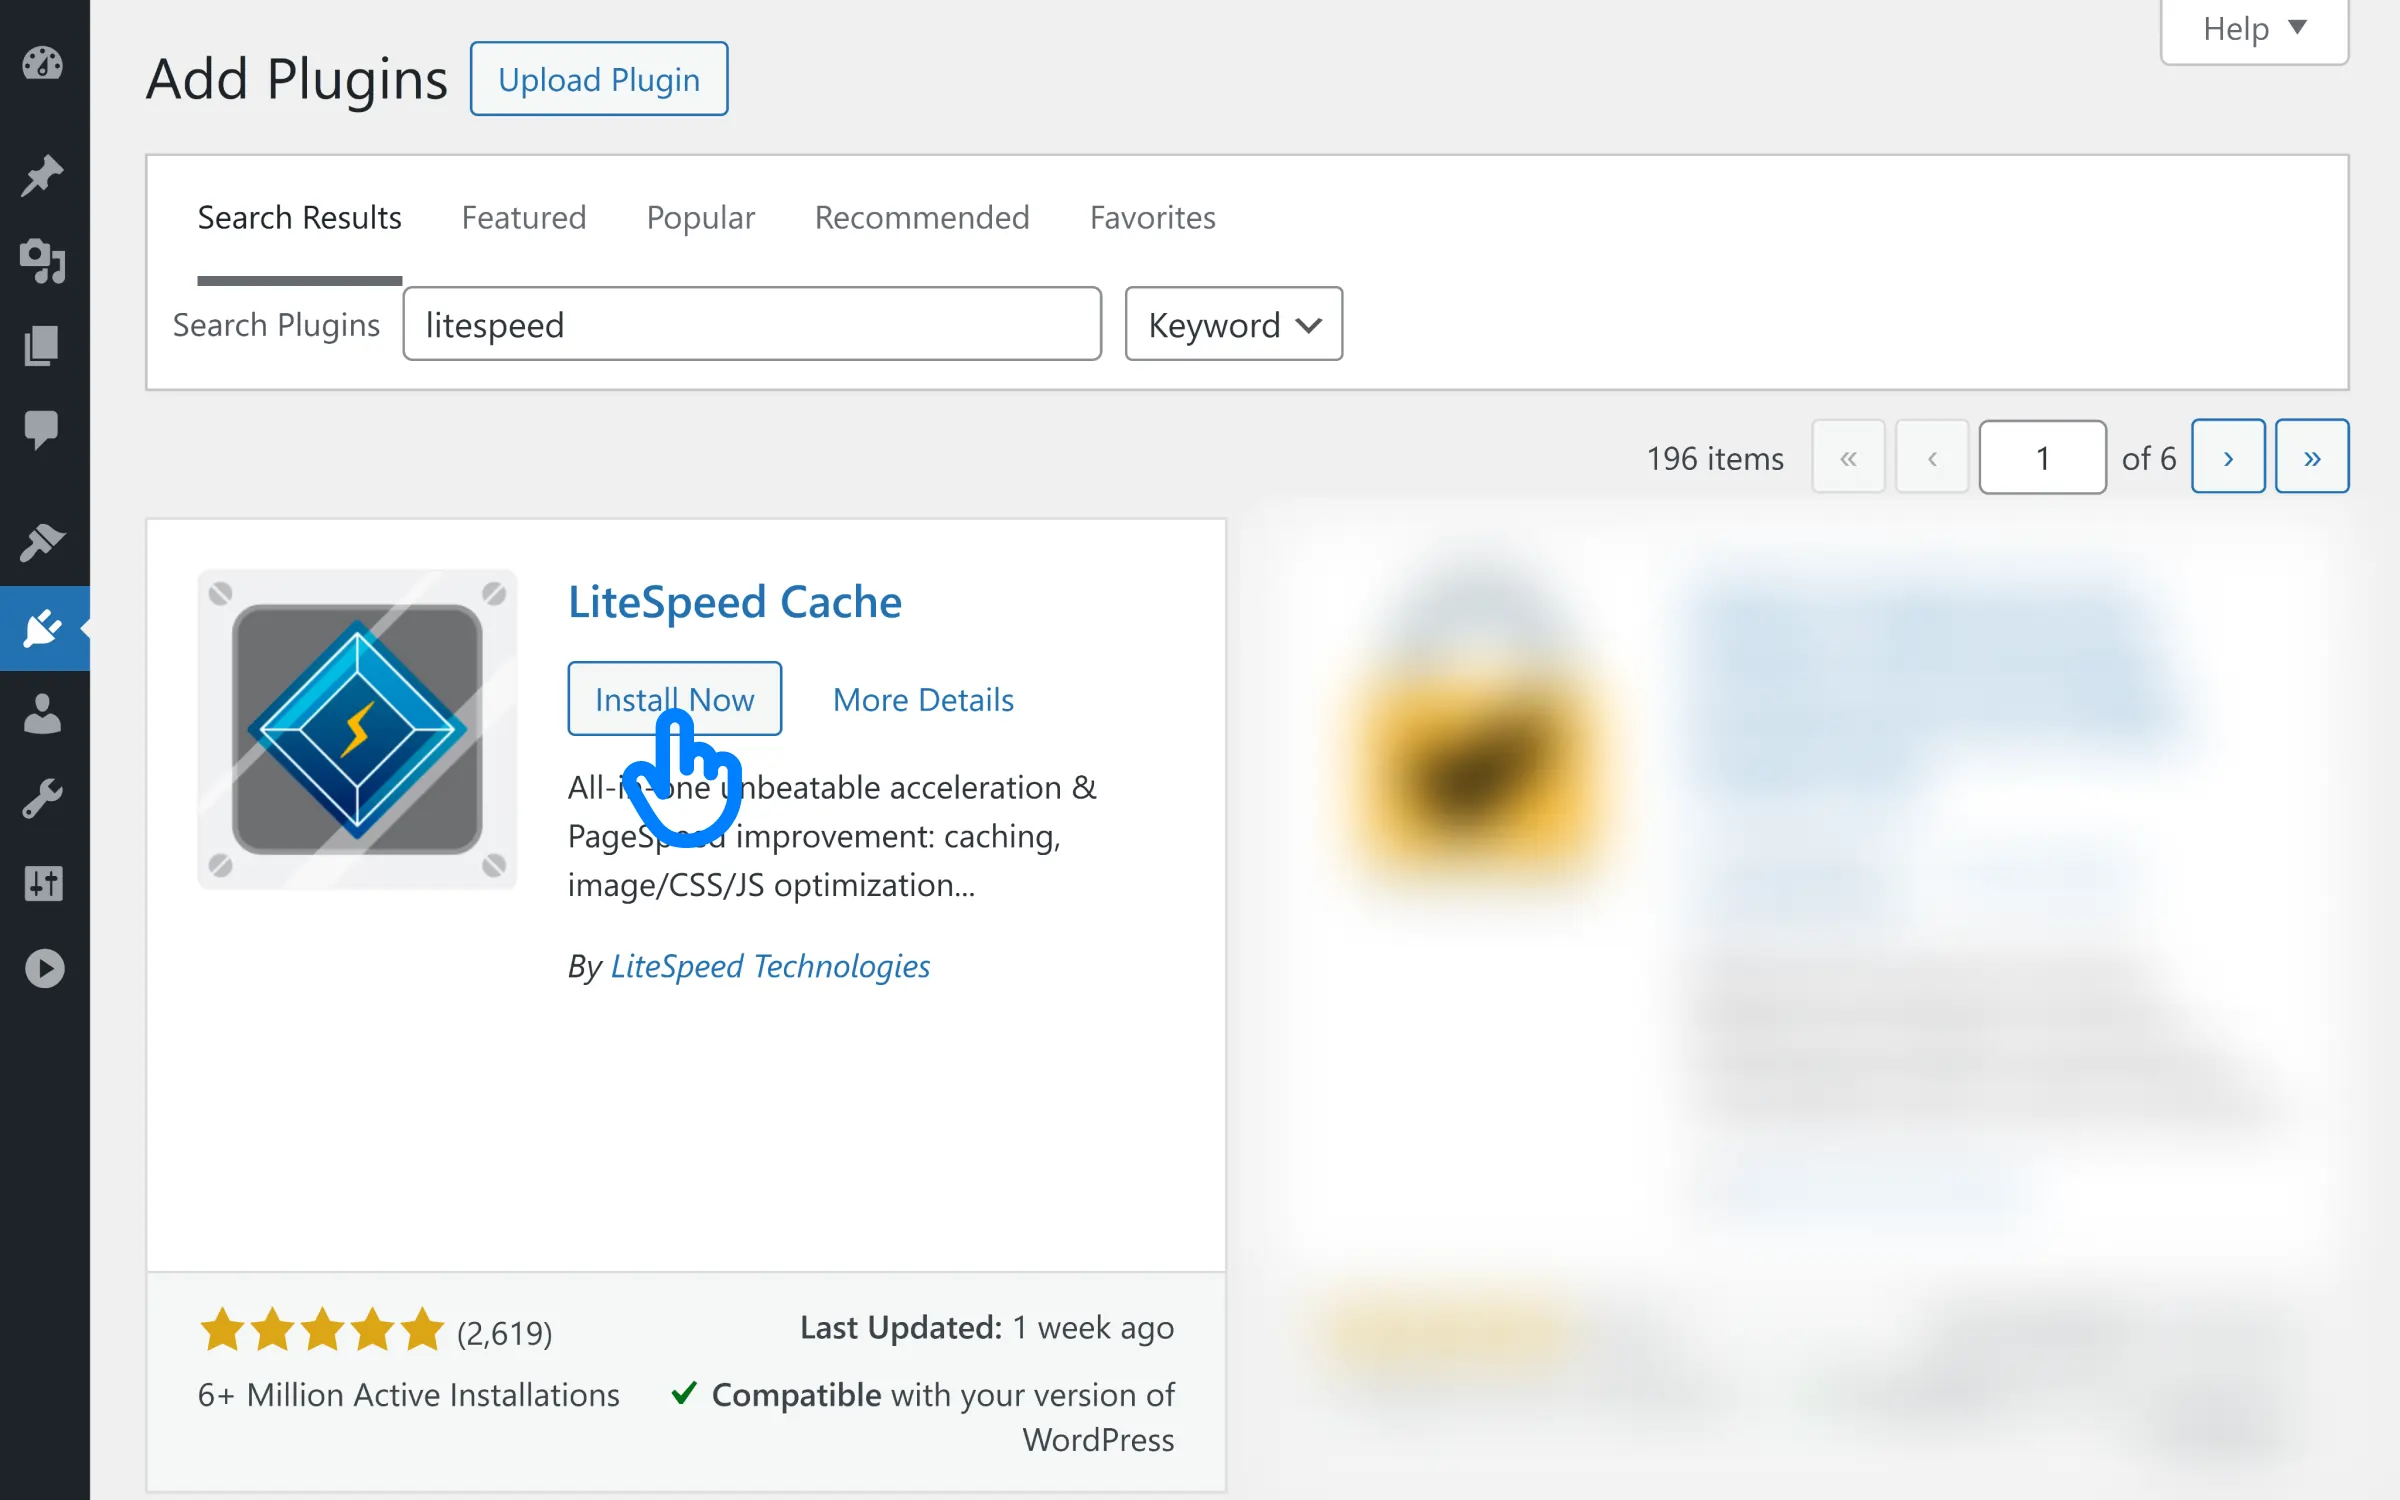
Go to “Plugins” > “Add New“.
Look for “LiteSpeed Cache“ > Install.
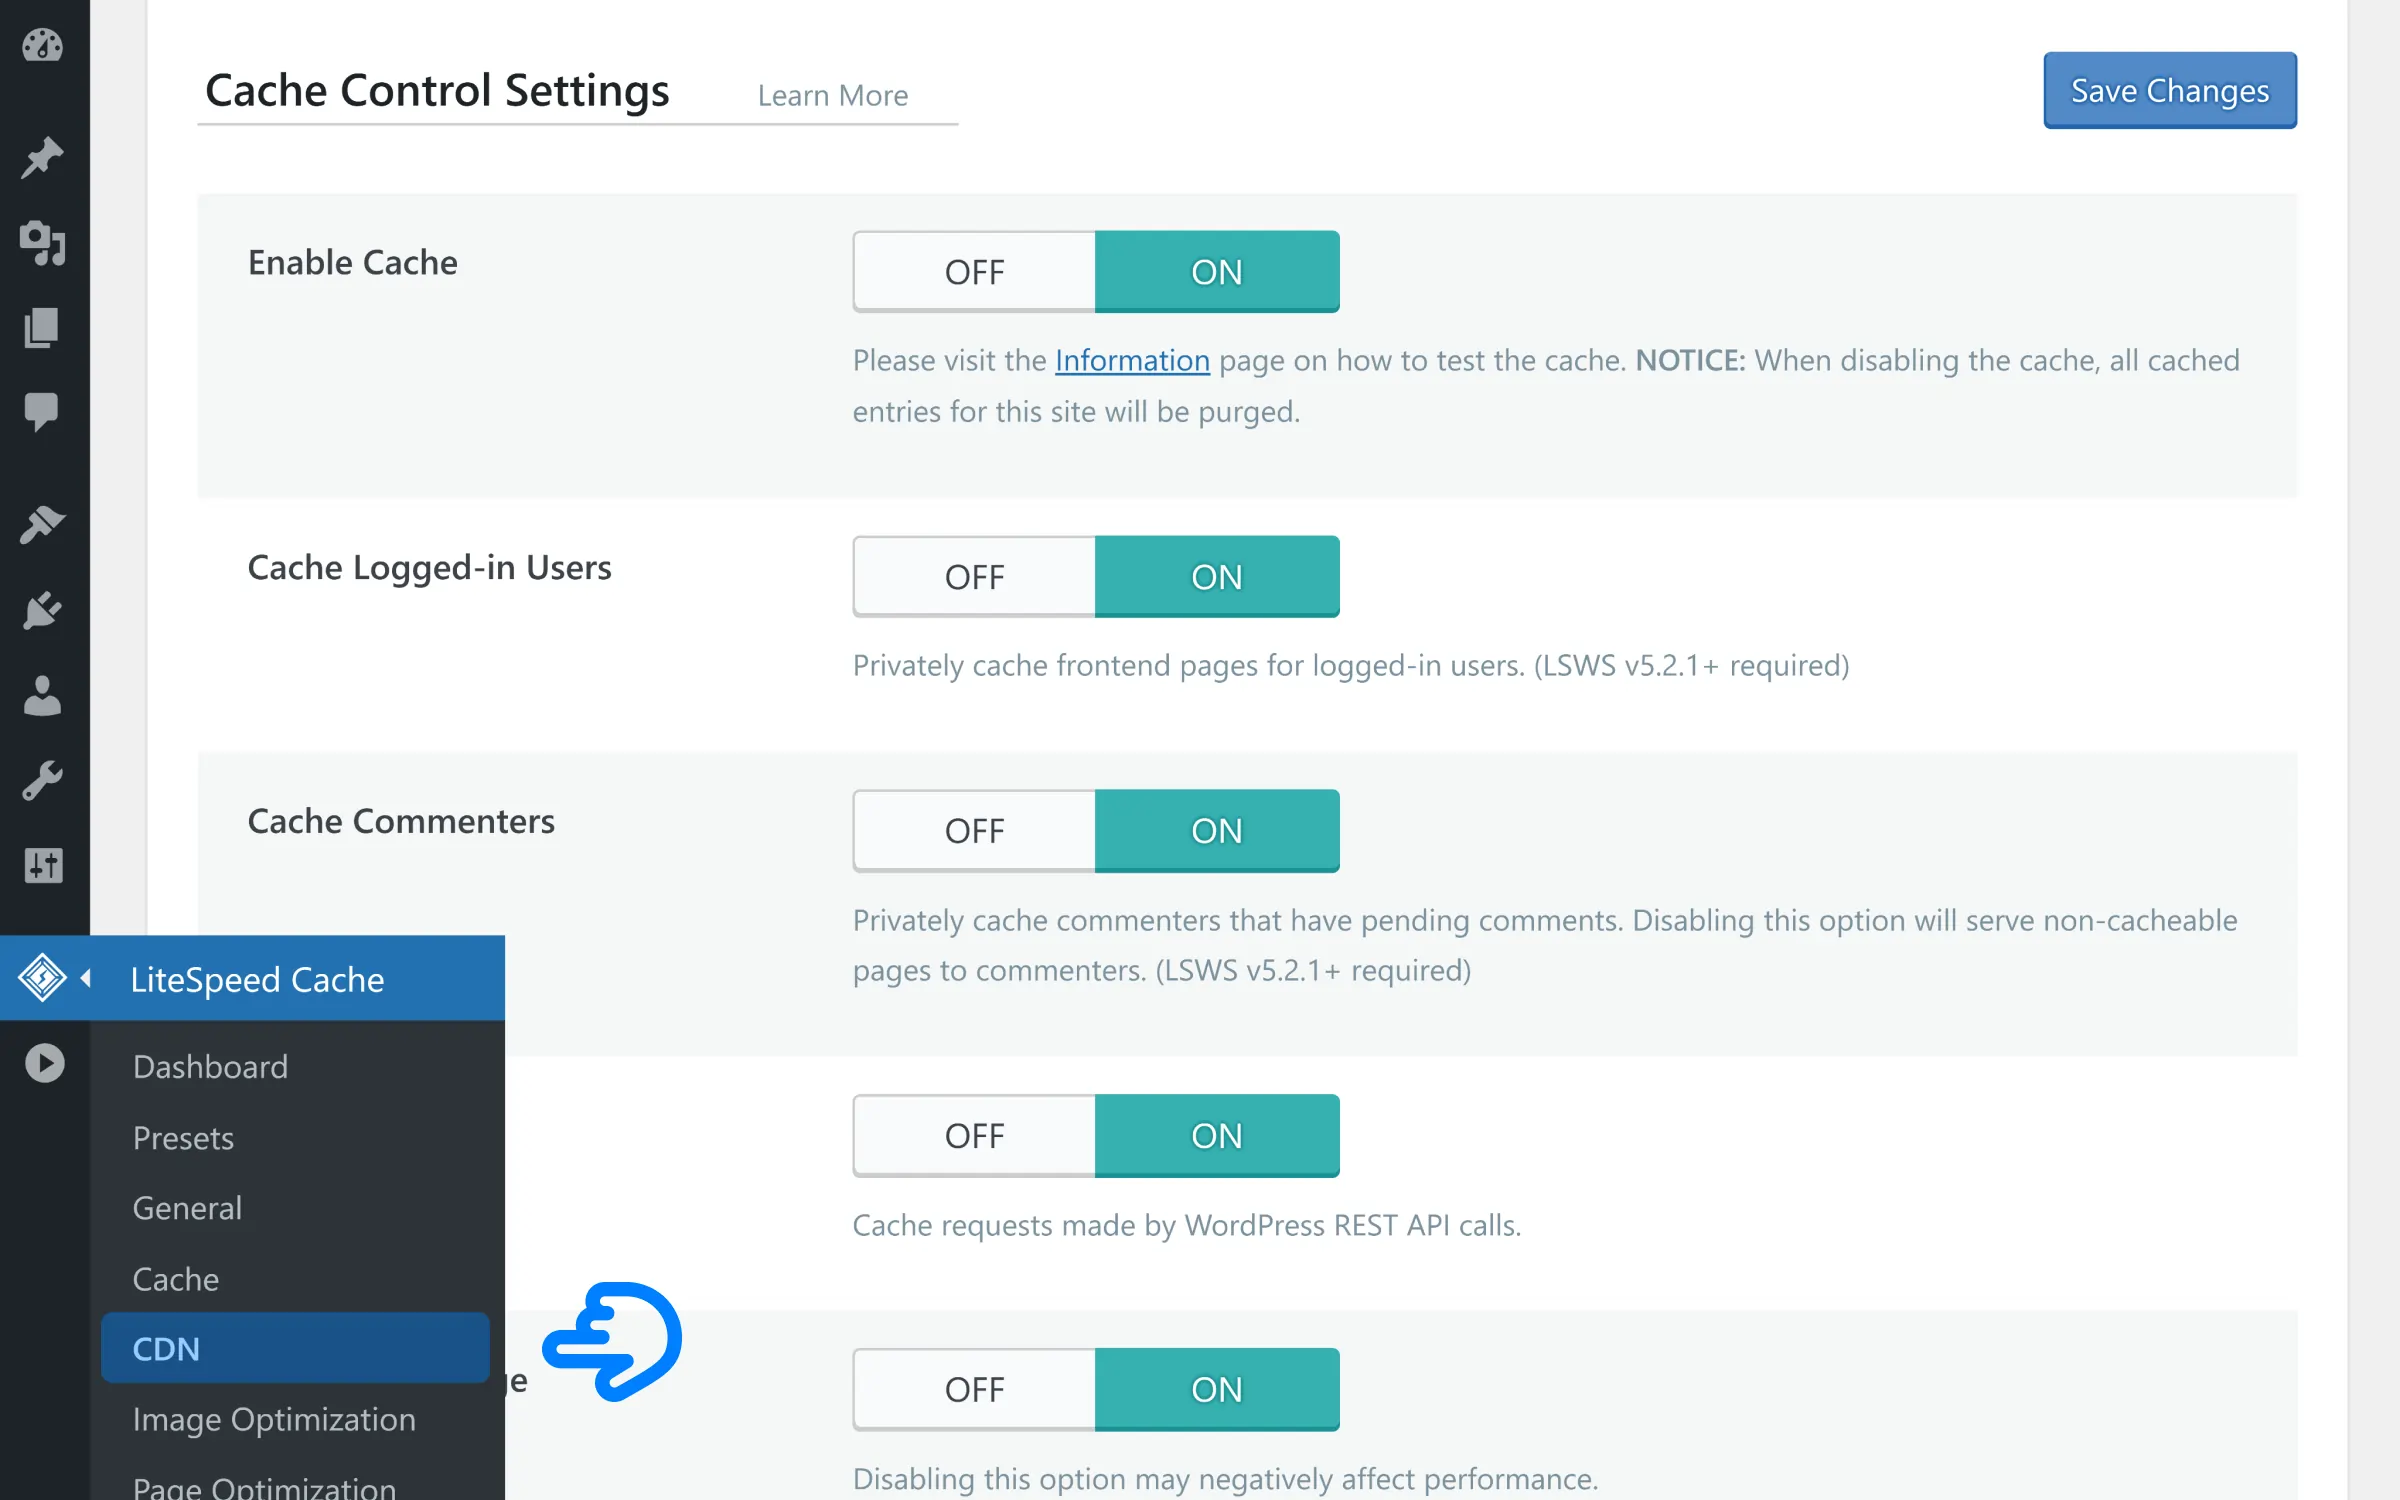
Go to “LiteSpeed Cache” > “CDN“.
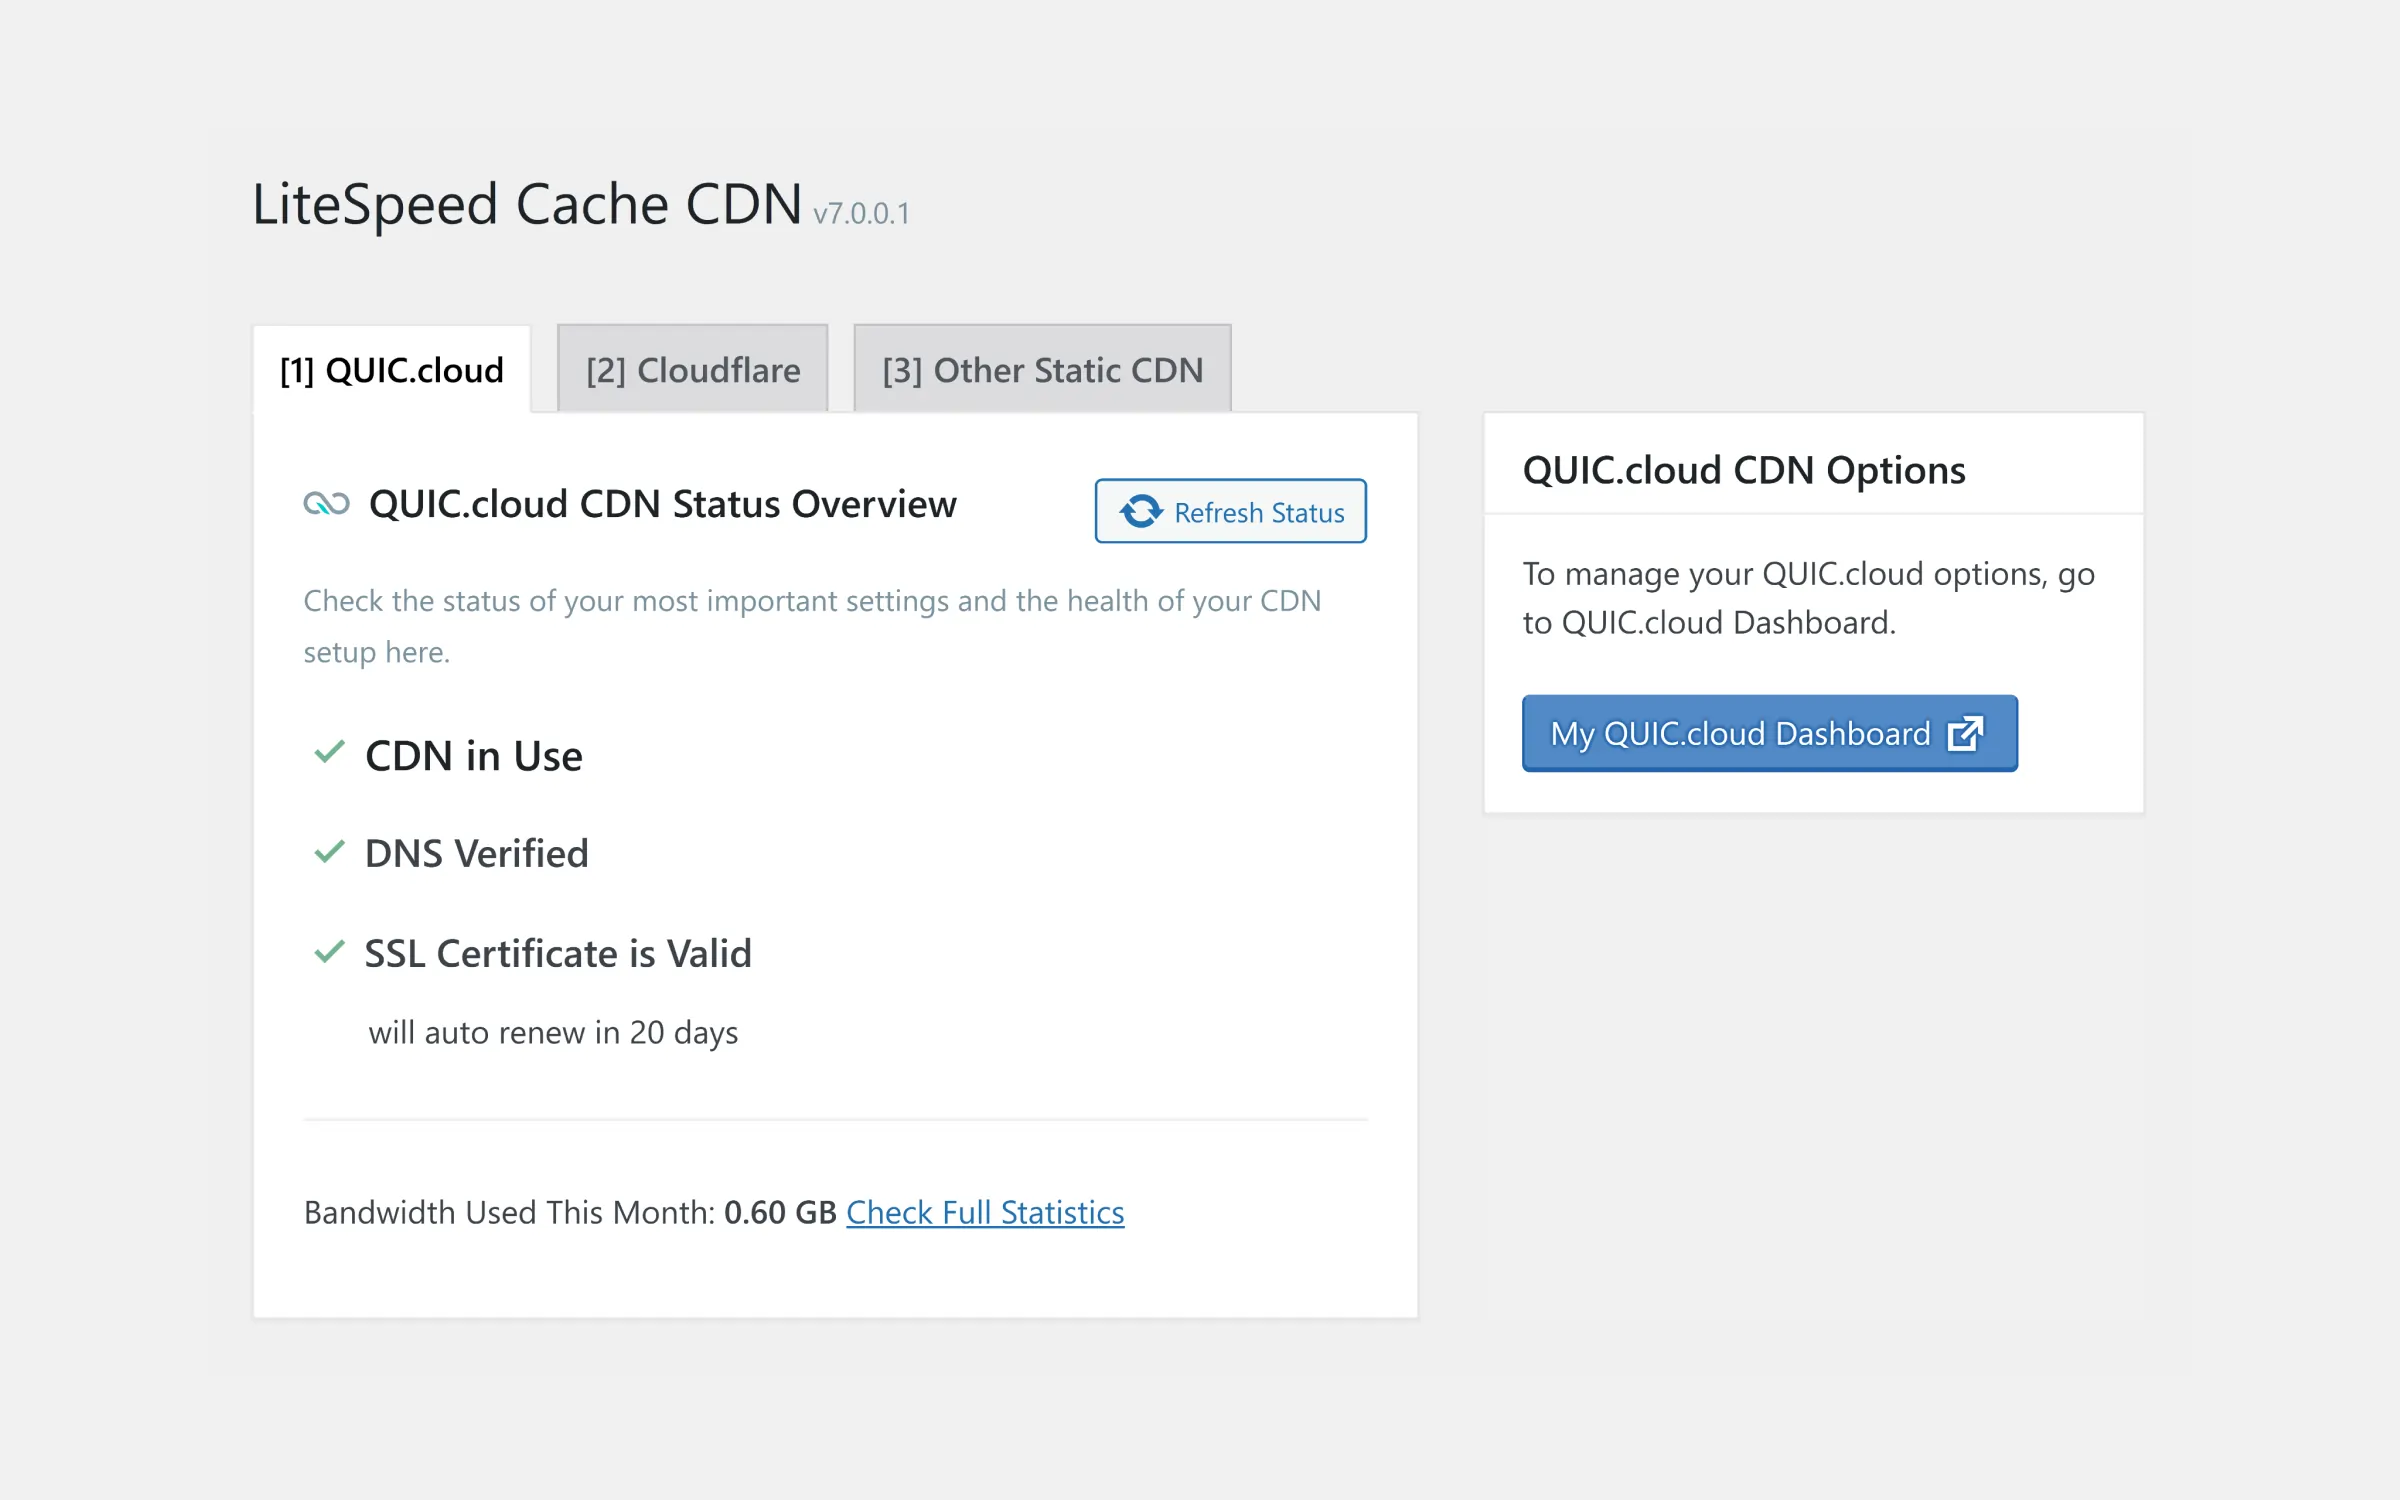
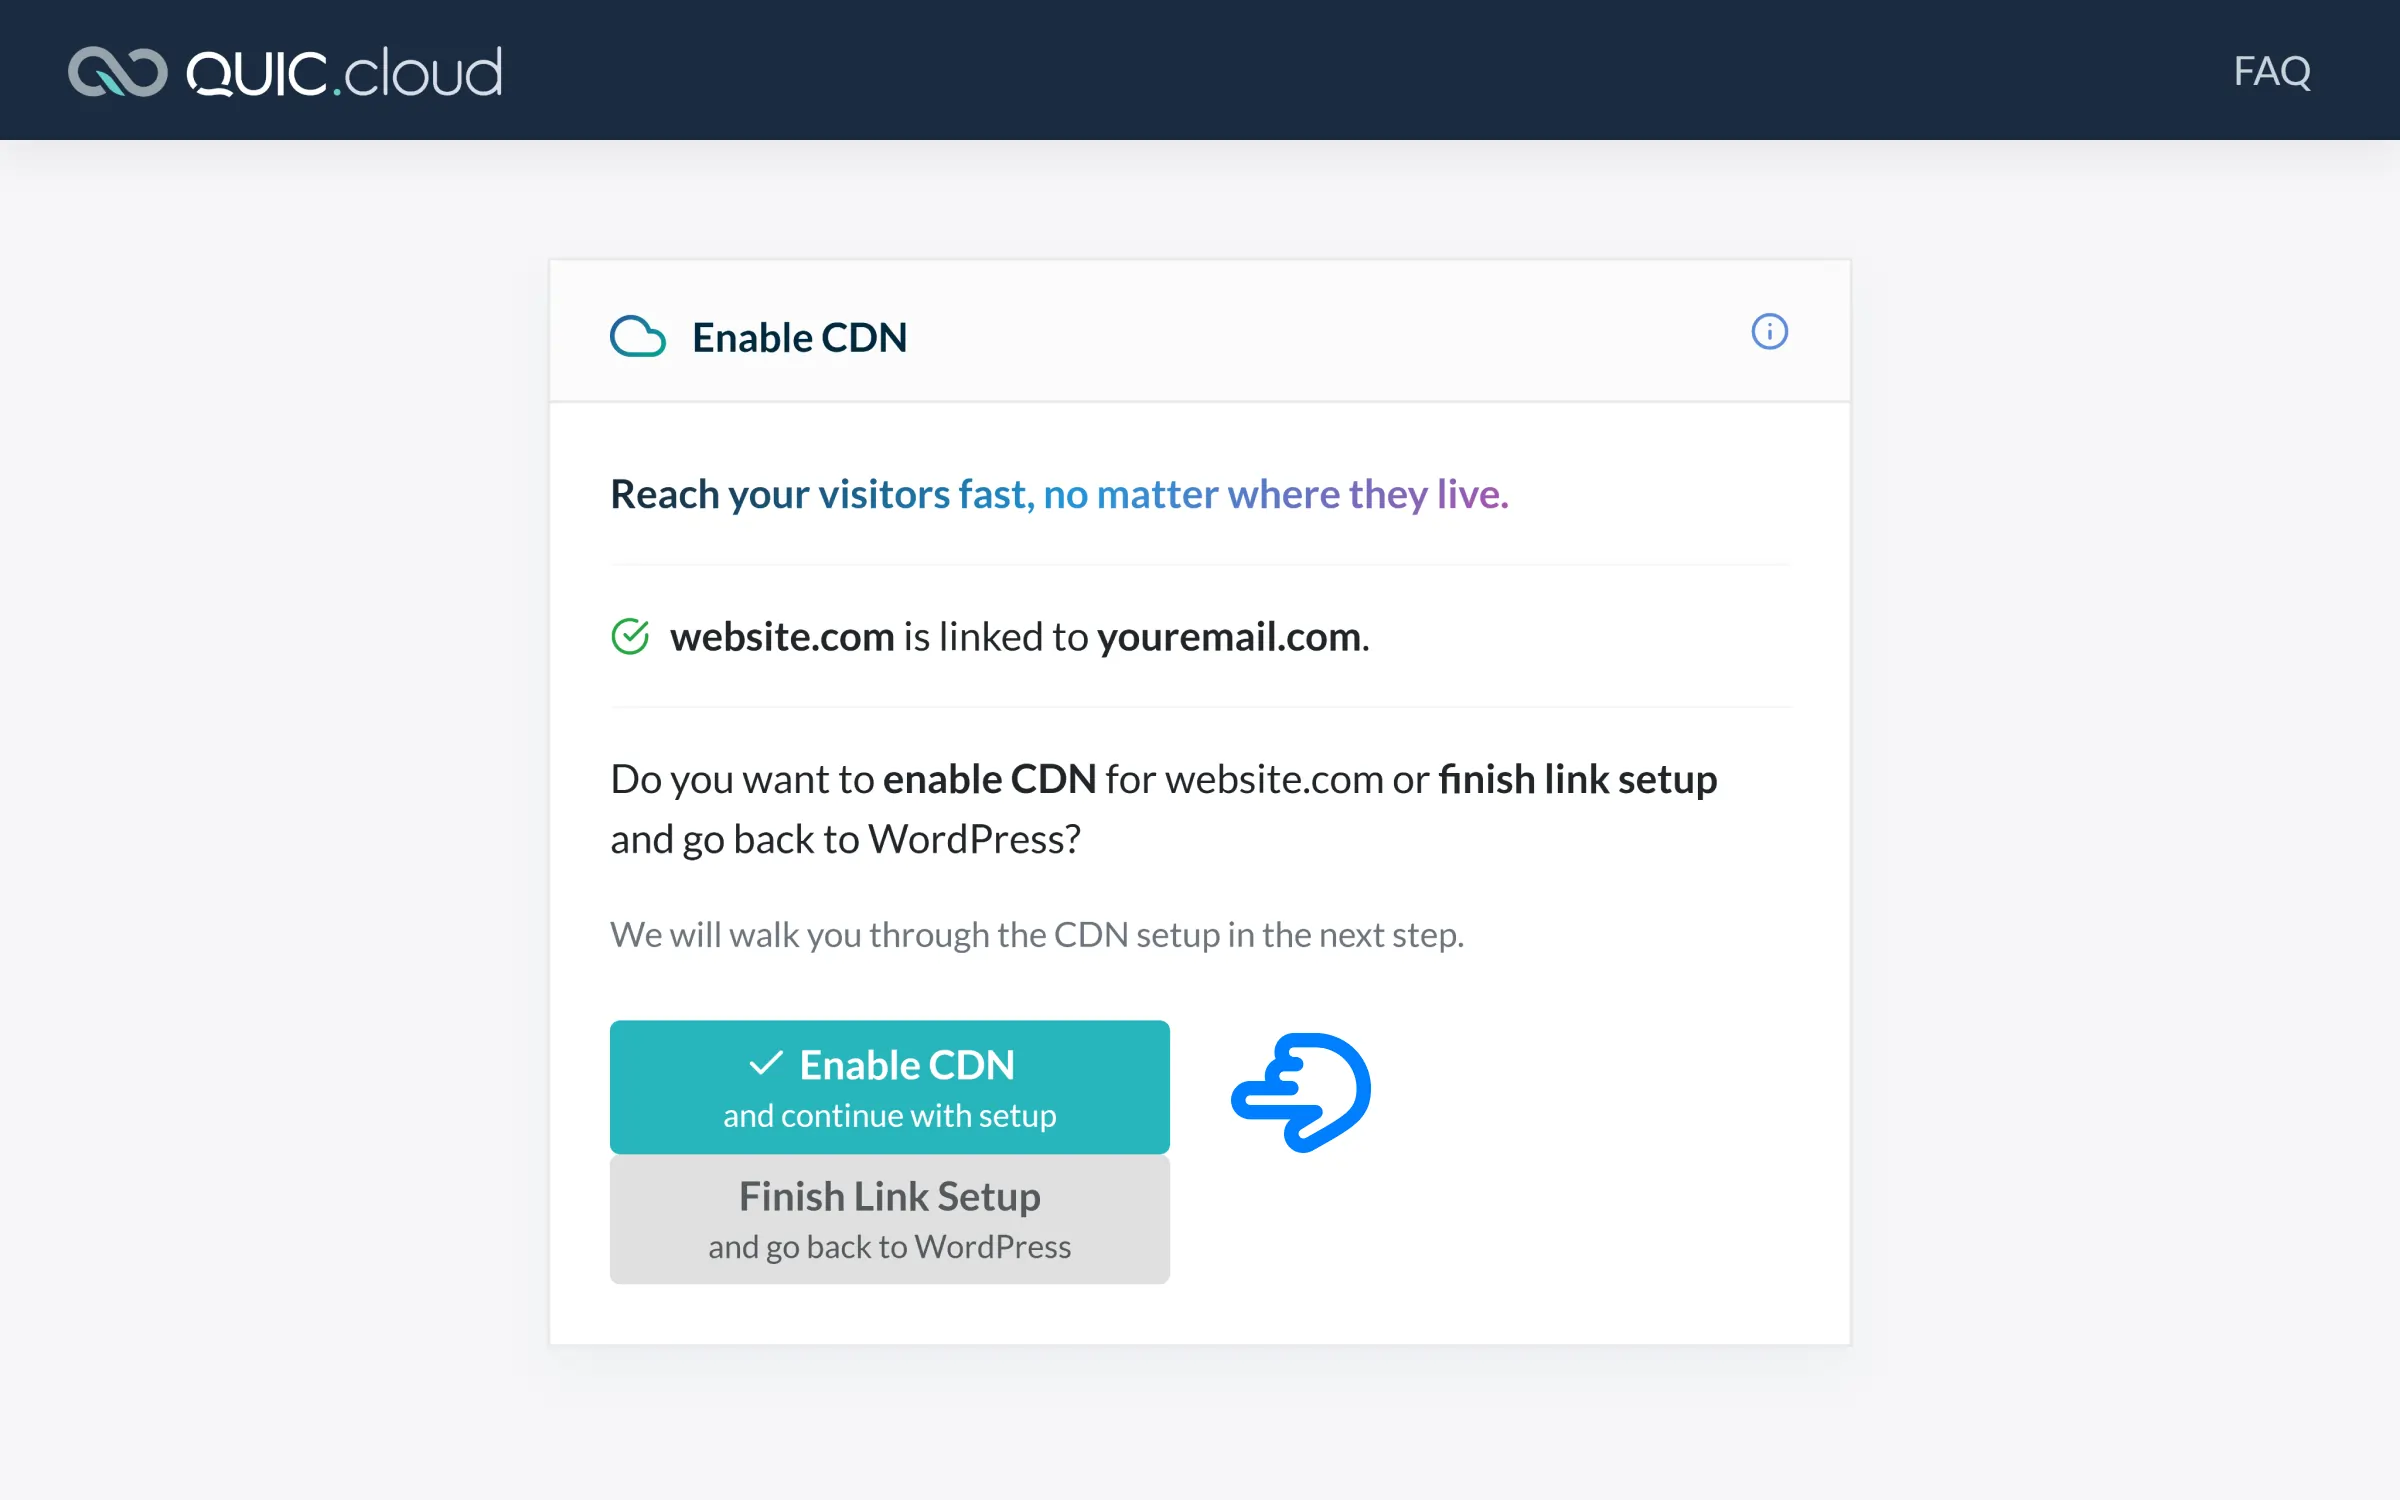
It will ask you to create a free QUIC.Cloud account.
Once you created your account, it should say something like “[YOURDOMAIN] is linked to [YOUREMAIL]”.
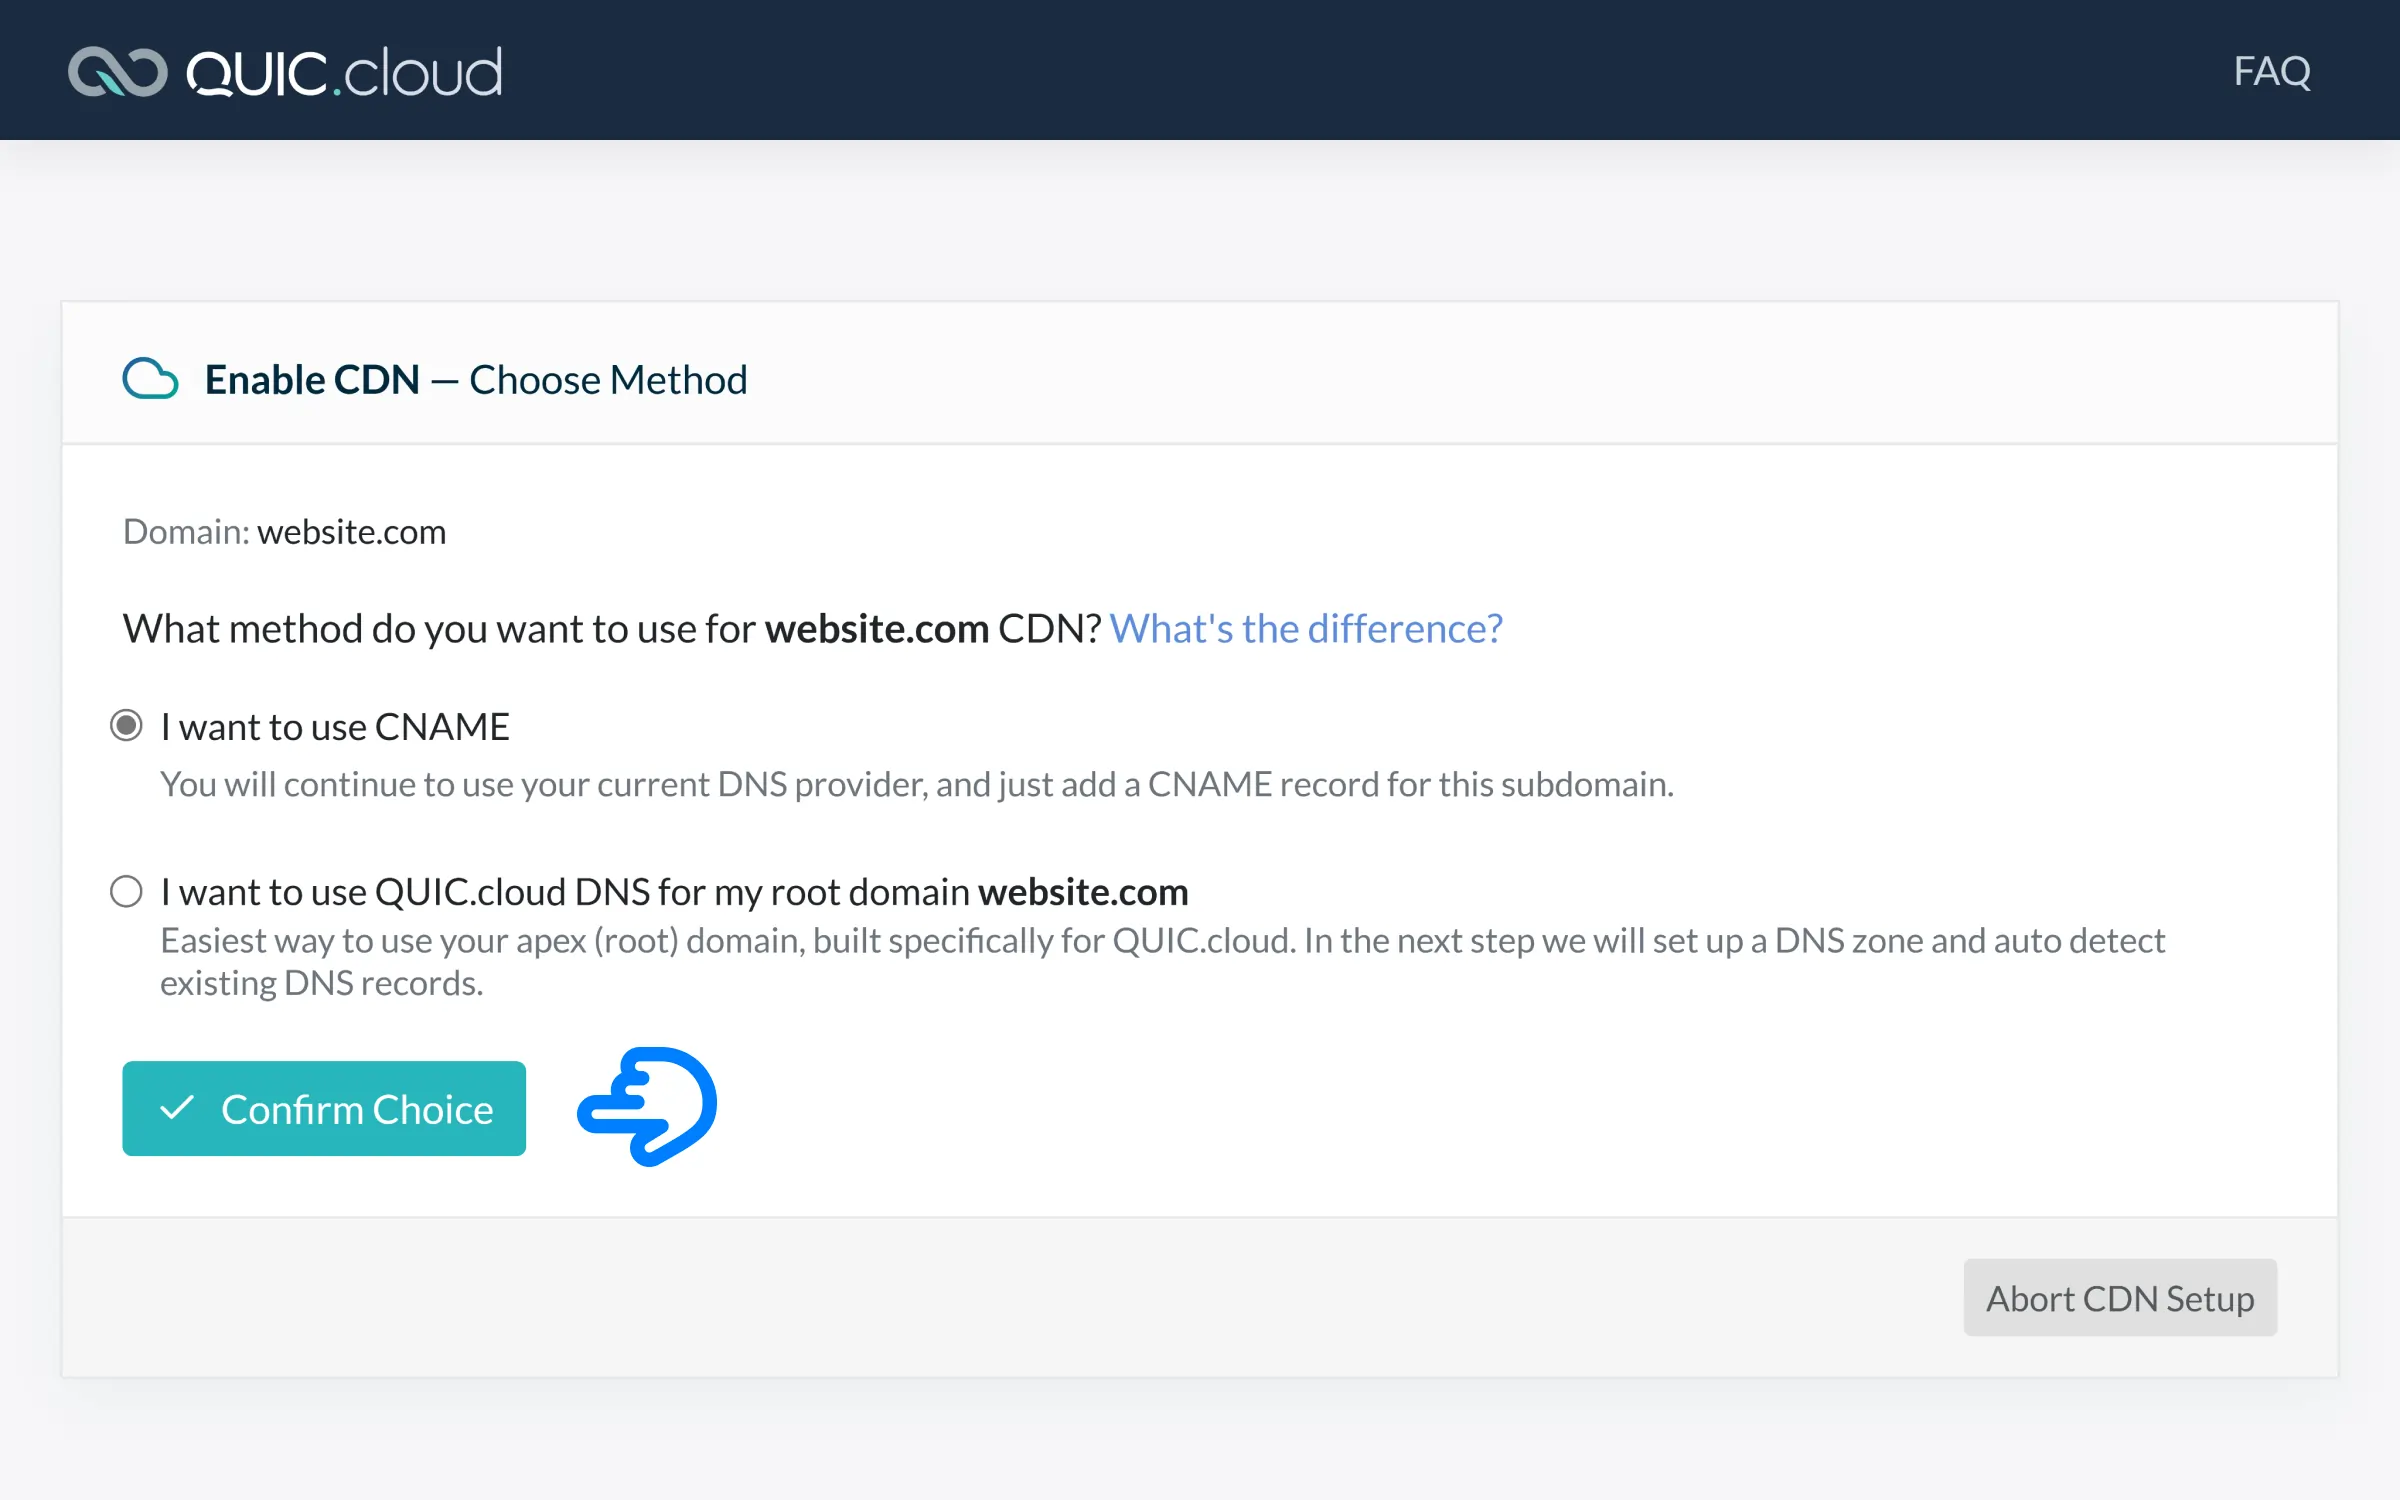
Click on “Enable CDN“.
Choose the CNAME option.
✱Note: Choose the DNS option if your site doesn’t have any prefix like “www” or similar. (Here are the instructions for that).
At this point they’ll give you a CNAME record to add to your website. (Keep this tab open).
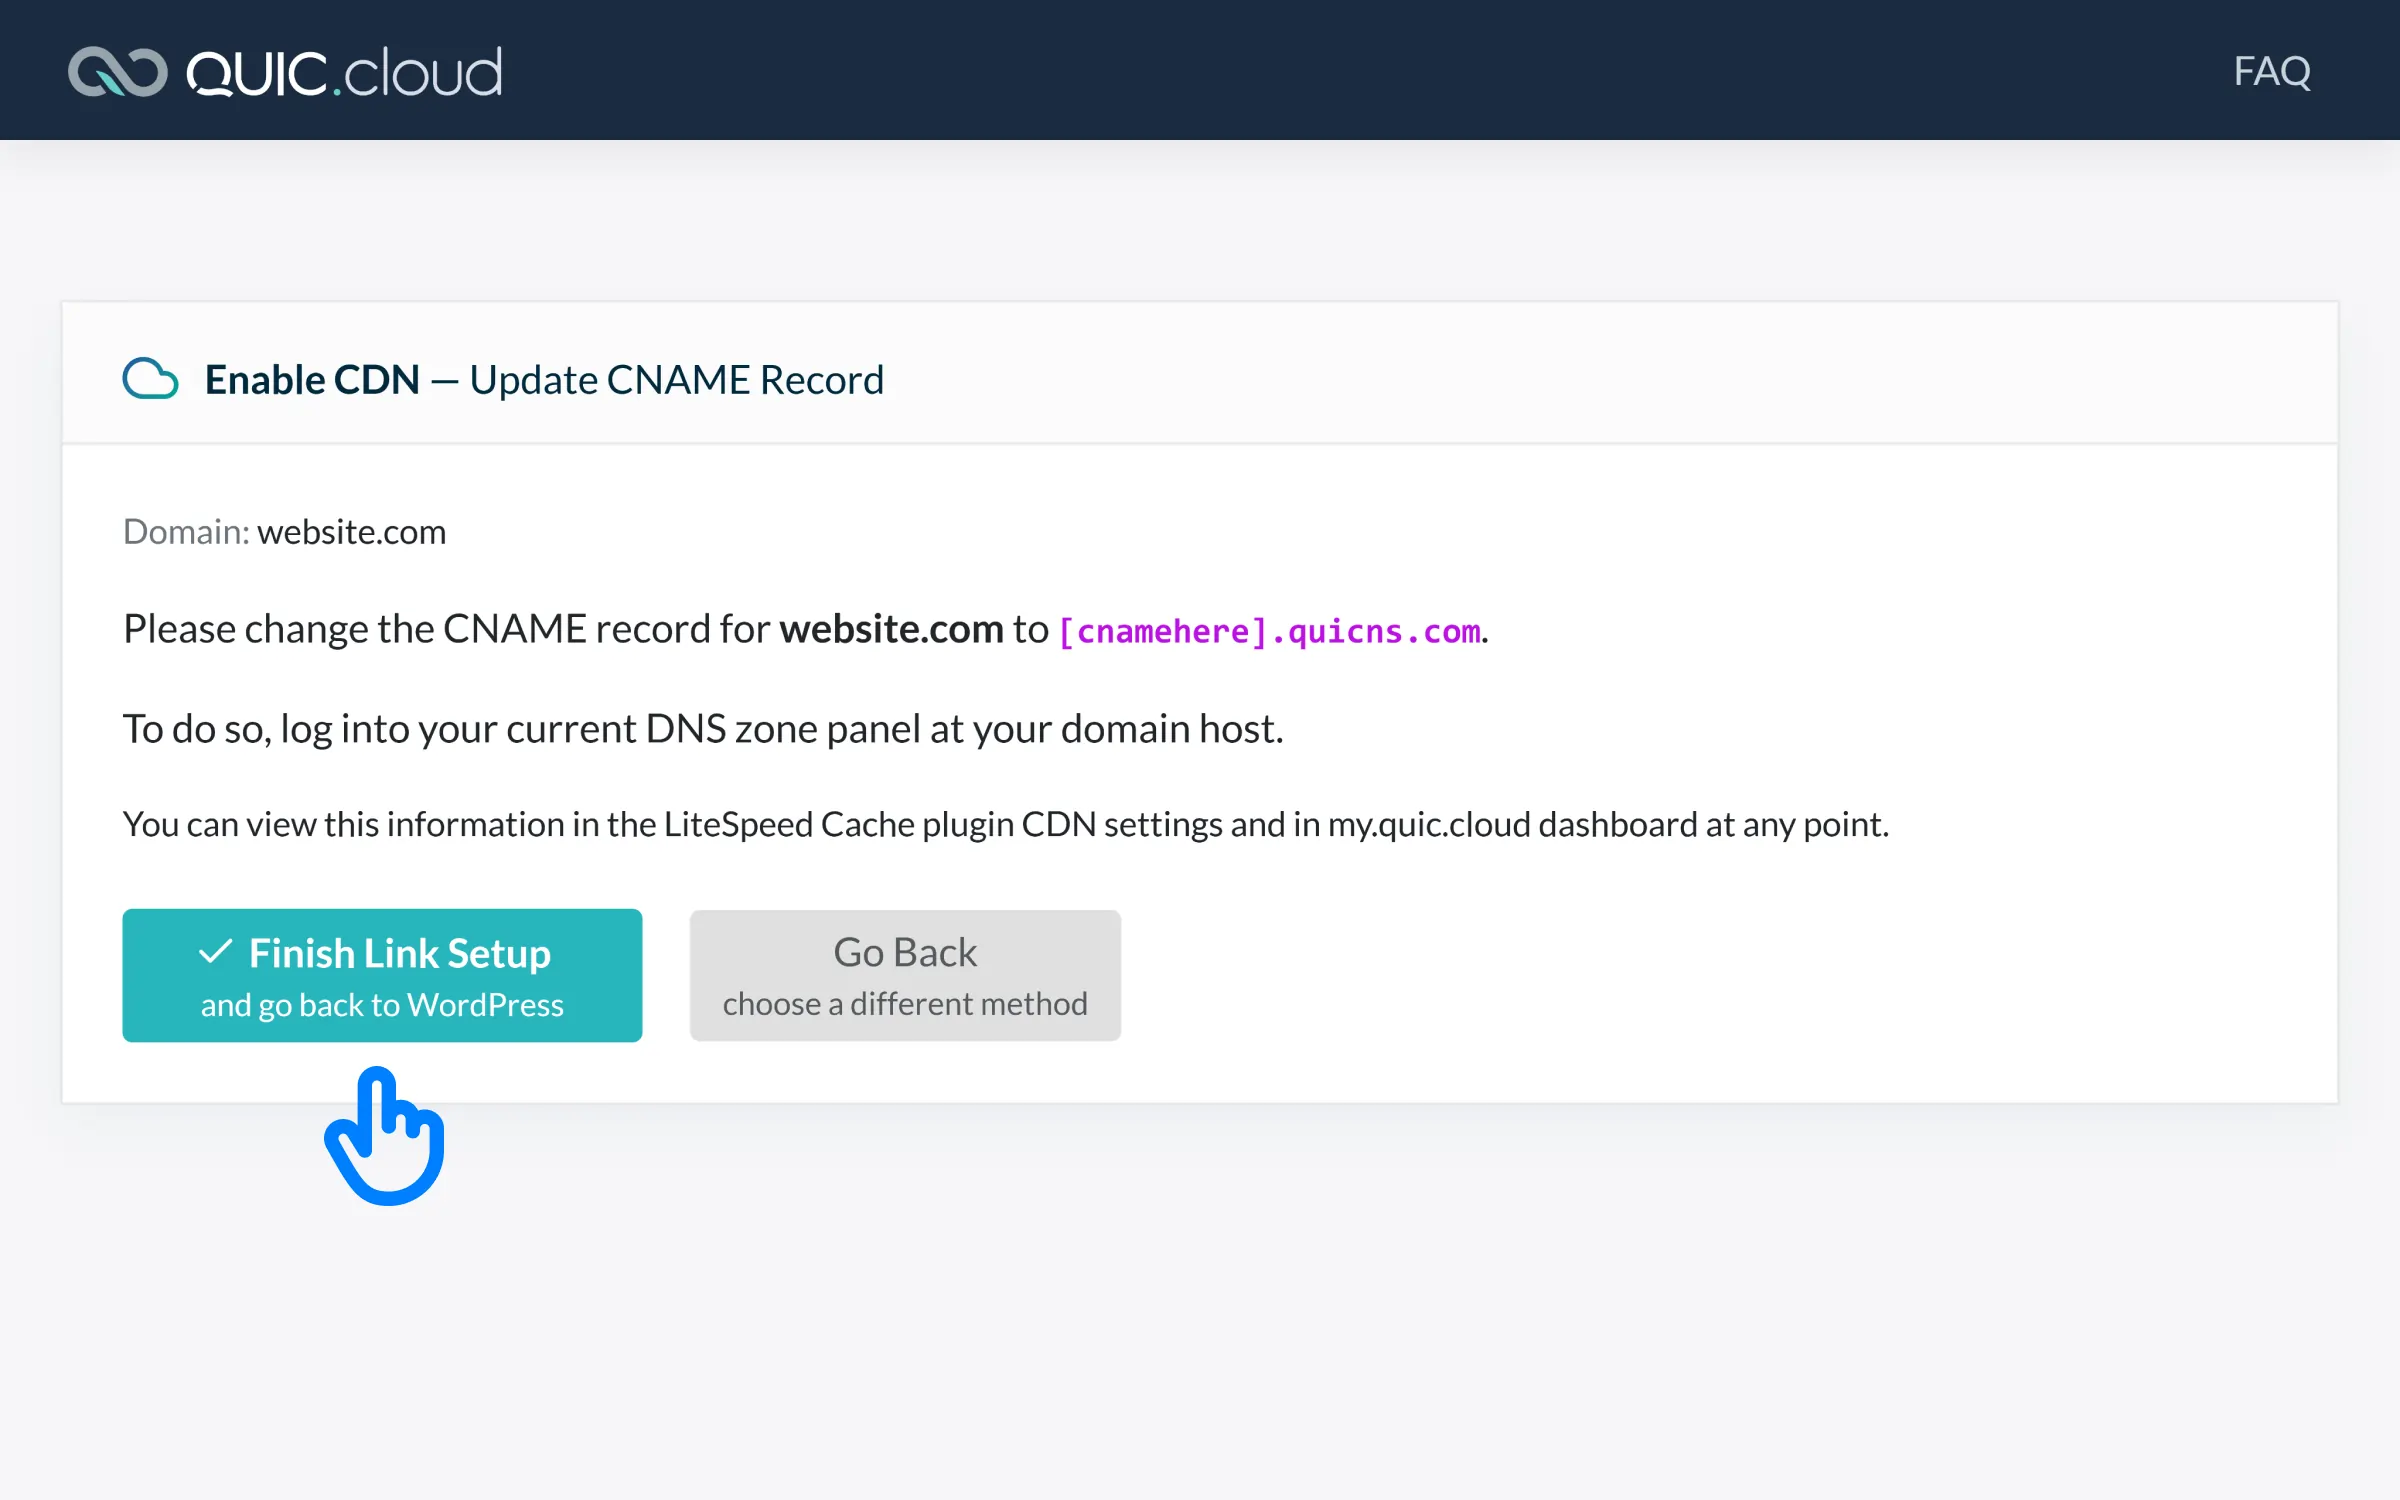
In a new tab go to your Webhost’s Cpanel.
Go to “Zone Editor” under Domains.
Click on “+CNAME Record“.
Add your site prefix (like “www”).
And the CNAME you received from QUIC.
Now go back to the open tab and click on “Finish Link Setup“.
This will take you back to WordPress.
It should now tick “CDN in Use“.
And that’s how you setup QUIC.Cloud CDN.
Self-host Fonts
Okay, so before things went south, I was using Google Fonts through Elementor. The performance was atrocious.
It was loading the entire font family … every single weight. 💀
And honestly, what if something went wrong? Like, an issue with the font … it’s not like that’s never happened before.
Remember back in July of 2024 when the Inter font update messed up millions of websites? Yeah, that kind of thing can happen!
I’ve always wanted to design my own fonts, so I went for it. But hey, you don’t have to do that. Just find a font you like, download the files locally, and we can get started from there.
First, go to Google Fonts and download the font you like.
Open the downloaded Zip file.
We want to select only the weight that we know we’ll use, so for this example I’ll use Medium and Bold.
But notice that Google gives us .TTF files.
We wanna convert these into WOFF2.
If you don’t know what WOFF and WOFF2 font formats are you can read more here. (They are fully supported by all browsers).
Tools like Transfonter and Font Squirrel are excellent for font conversion. For this tutorial, we’ll be using Font Squirrel.
Click on “Expert…”.
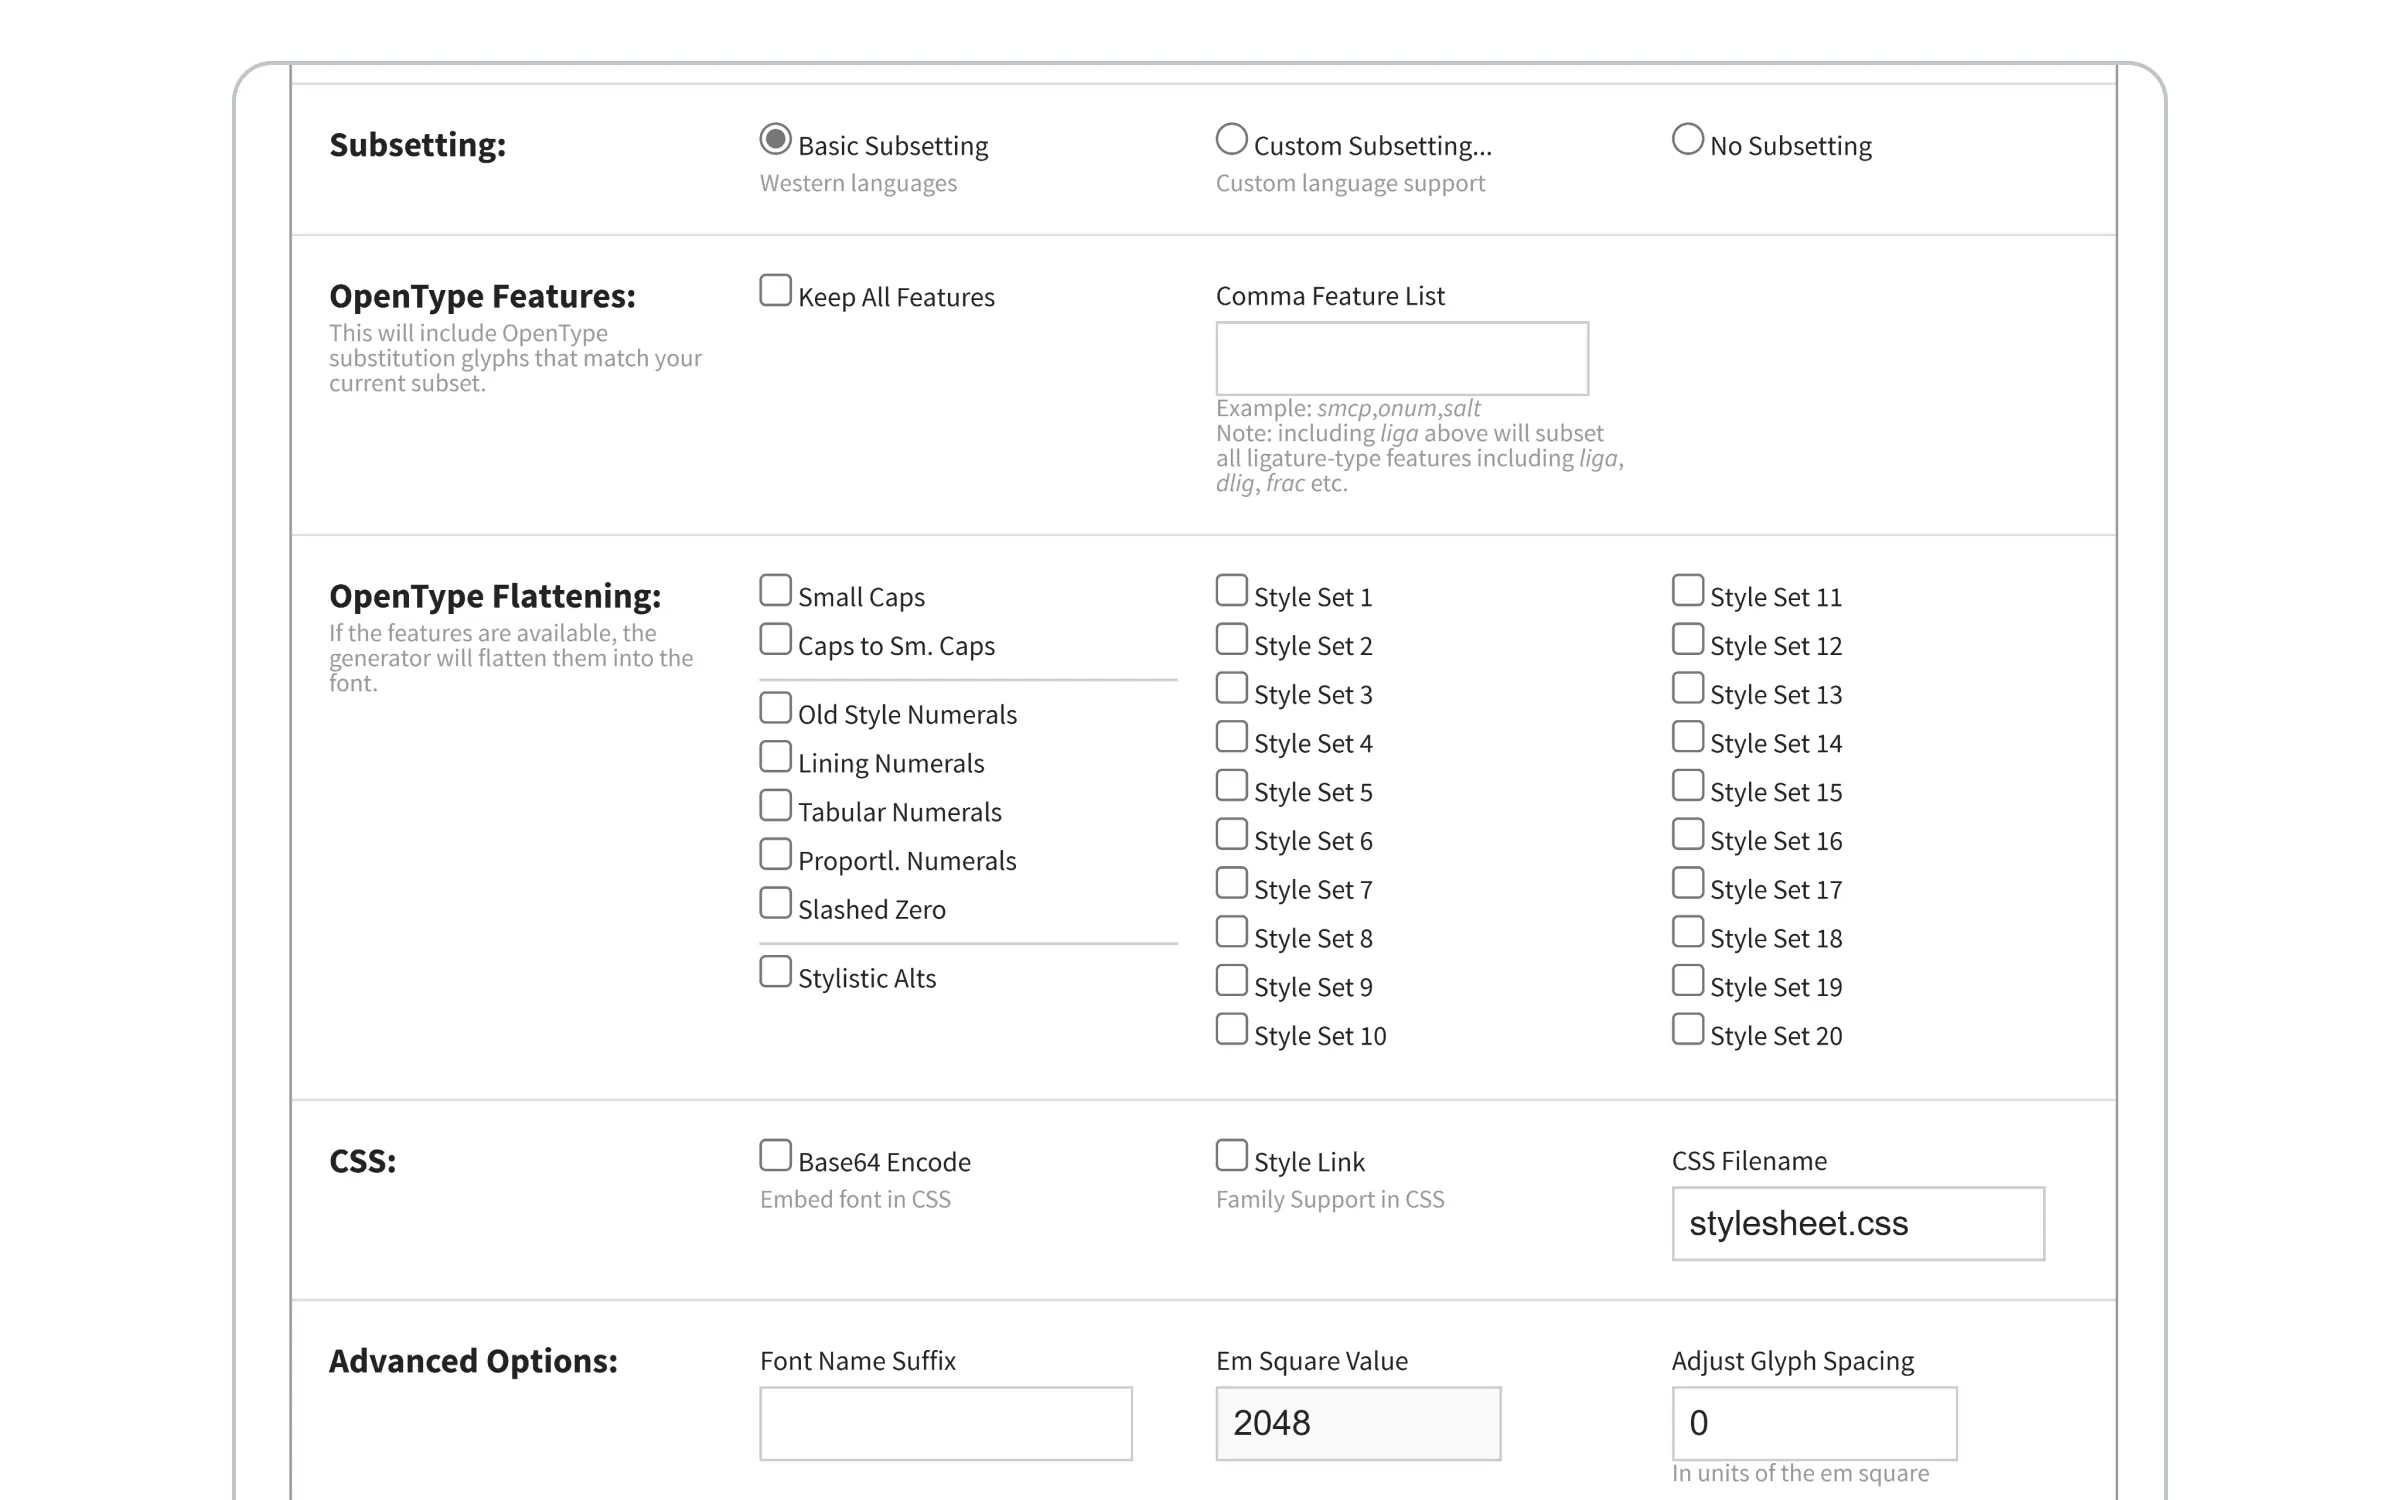
Before uploading, make sure to set “Vertical Metrics” to “No Adjustment,” and untick both boxes under “Fix Missing Glyphs.”
Here’s a full list of the settings I used:
Scroll back up and click “Upload Fonts”.
Upload your font files and give it about a minute (it may look like nothing is happening while you wait).
Once finished, a “Download your kit” button will appear.
Click on it.
Now it’s time to upload the new WOFF2 fonts to our own server. Go to your website’s backend platform (e.g. cPanel).
Navigate to the directory where your theme is installed. This might look like public_html > wp-content > themes > [your_theme_name].
It should contain your “functions.php” file.
Create a new folder named “assets“.
Inside the “assets” folder, create another folder called “fonts“.
Upload the files there.
Now go to your “style.css” and add the following CSS:
/* Apply the font to the body */
body {
  font-family: 'Inter', sans-serif;
  font-weight: 500;
}

/* Apply the bold weight to headings */
h1, h2, h3, h4, h5, h6 {
  font-family: 'Inter', sans-serif;
  font-weight: 600;
}
And that’s how you self-host your Fonts.
Lazy Load and Pre-load
Lazy loading is a clever idea.
Instead of loading everything on a page at once, it only loads what’s immediately visible.
What about Pre-loading?
Pre-loading is requesting the critical resources before the page is actually loaded.
Preloading is proactive; lazy loading is reactive.
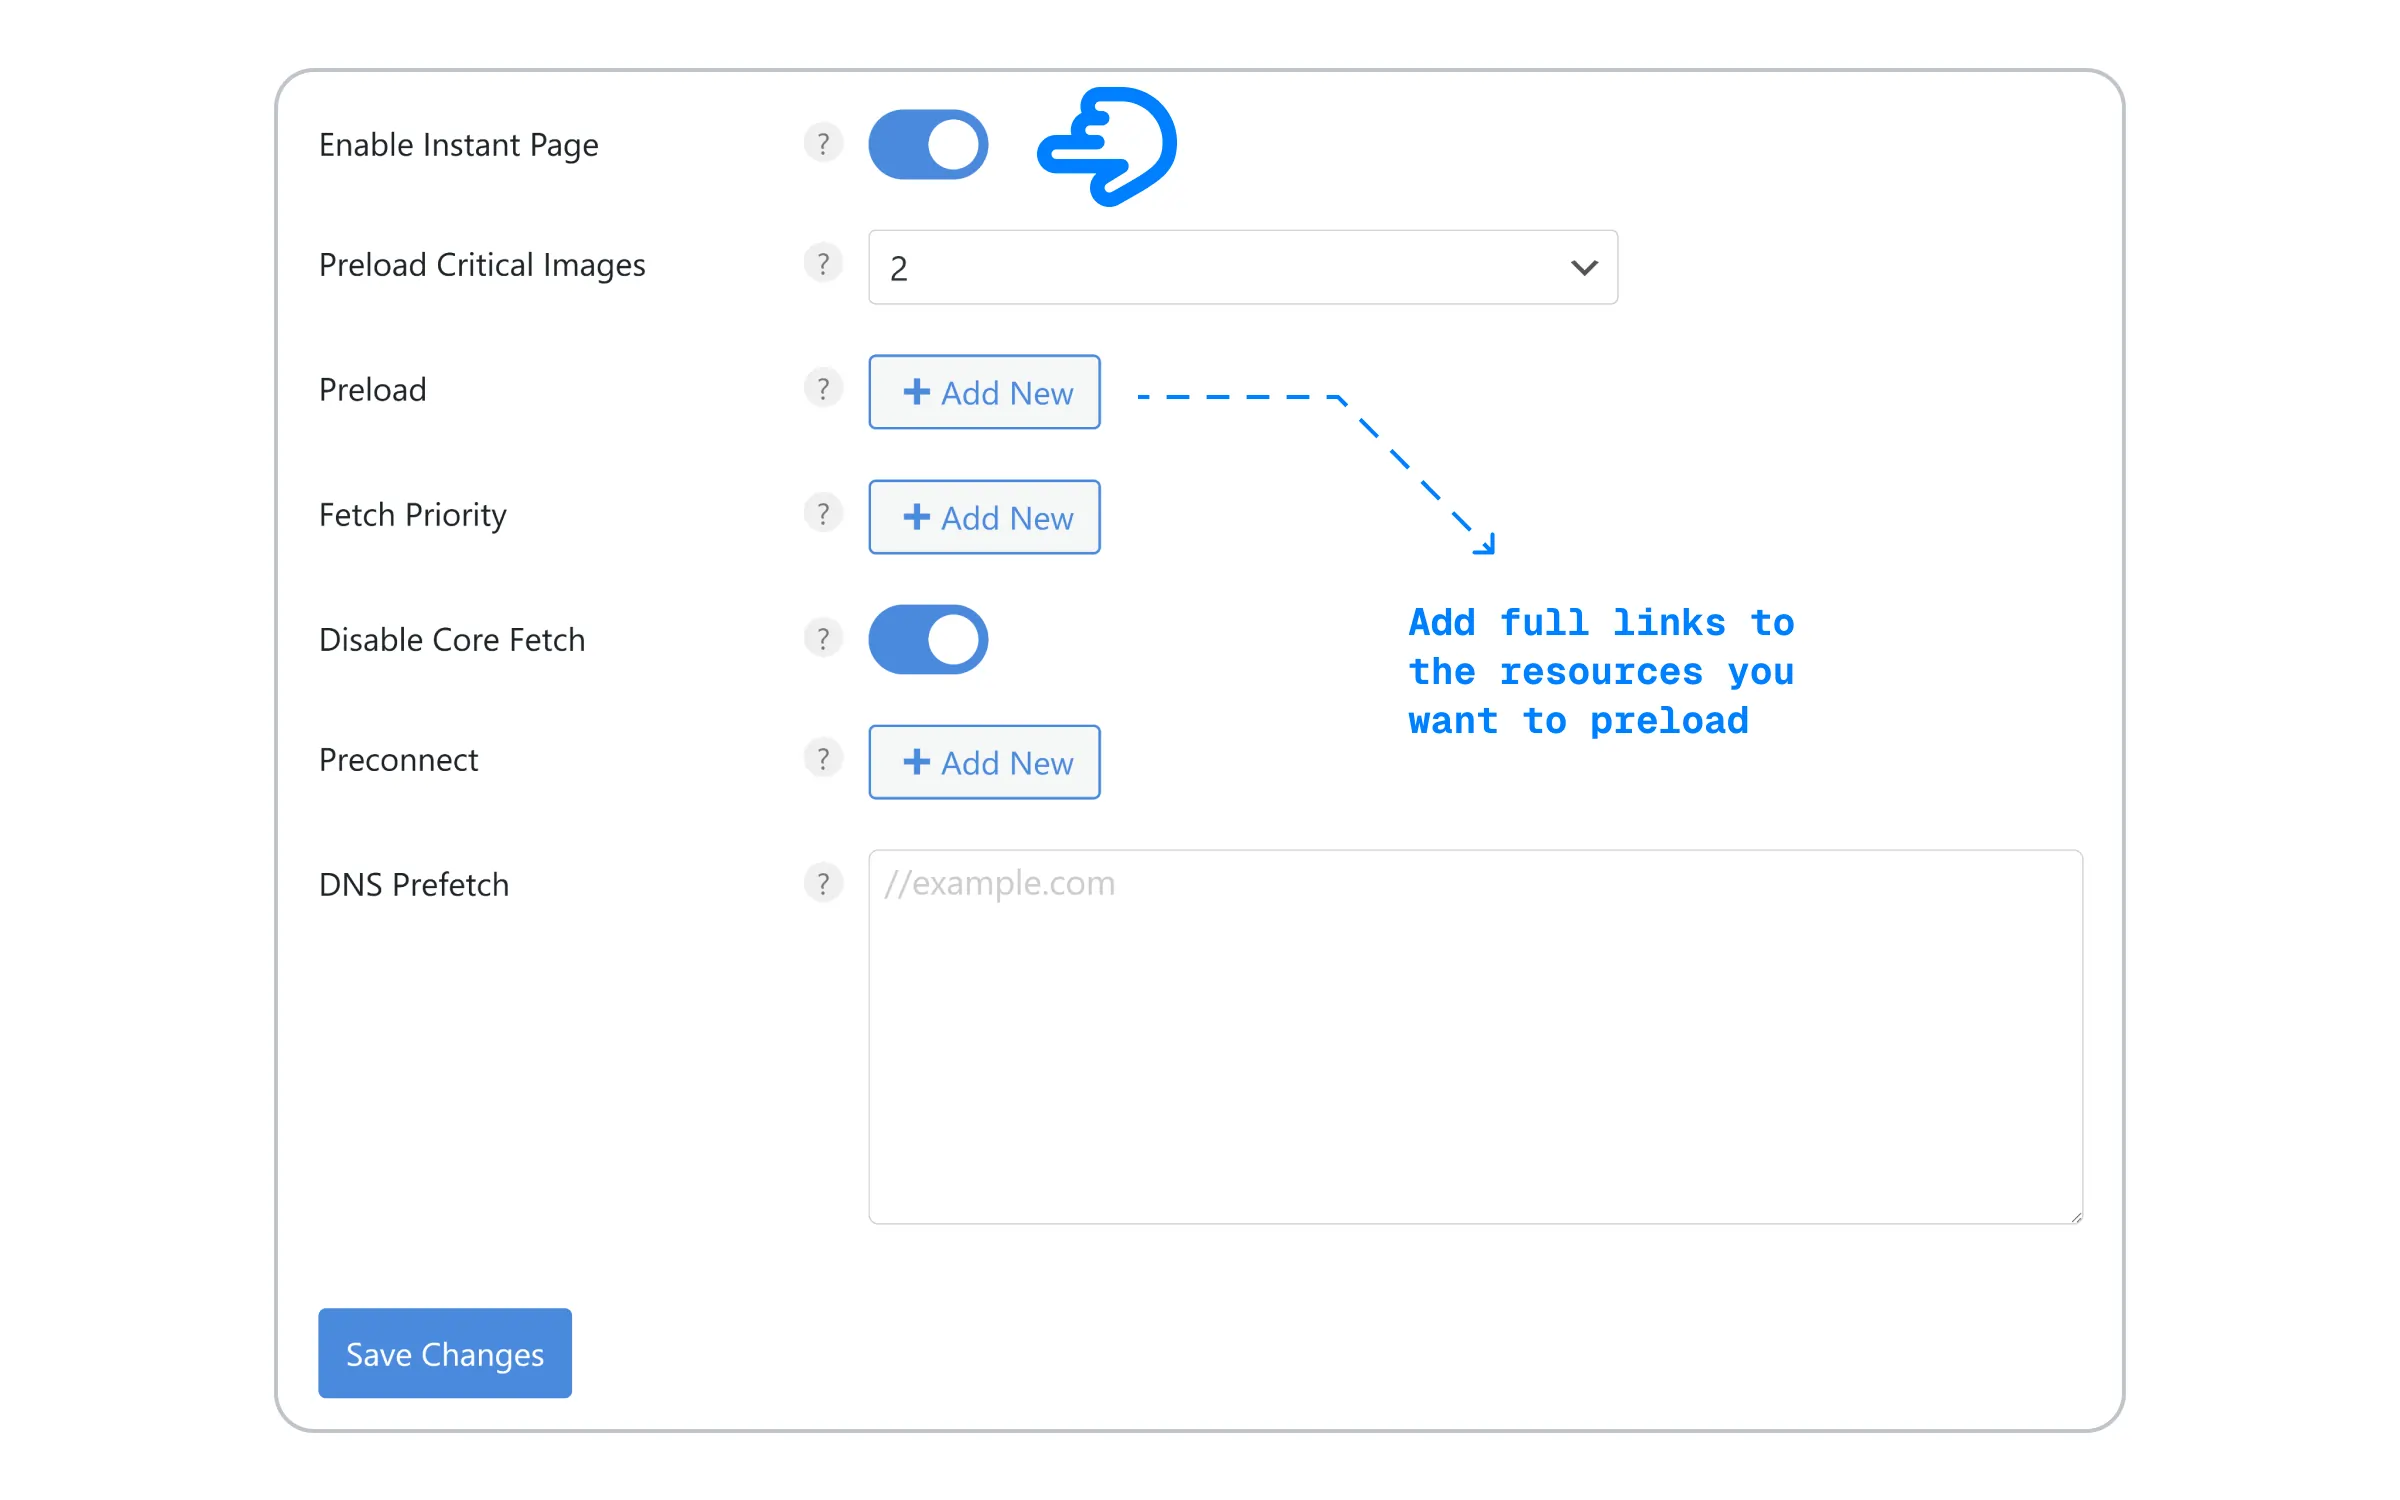
After installing, head over to “Settings” > “Perfmatters” and then click on the “Preloading“ tab.
Here are my settings:
For lazy loading it’s pretty straightforward.
Go to the “Lazy Loading” tab. Turn it on and specify how many images you want to keep unloaded at the top of the page.
@Author
Is that pretty much it?
@Reader
Yes, and the results are amazing!
I’ve managed to slash my HTTP requests from a ridiculous number down to fewer than 14. My average page size down to just 100KB!
Pretty slick!
External Factors
Here are some things you may not be able to control:
Dynamic Pages. Sometimes your pages can change based on different conditions you’ve set. For example, based on location, logged-in/out users, user-generated content, and so on …
ISP Throttling: Internet Service Provider bandwidth limitations. Or unstable internet connection due to poor infrastructure. And even network congestion in busy areas.
Distance. Requests between distant locations (e.g., US to France) can cause minor delays. Throttling helps mask these delays.
Web Server/CDNs Performance. You have no control over a shared hosting or the CDN you are using other than choosing the best options.
When you measure your website speed in PSI, underneath your score, you will see a list of potential sources of delay, or culprits.
This is found under the “DIAGNOSTICS” tab.
@Author
What are METRICS? 🤔
@Reader
There are currently five: FCP, SI, LCP, TBT, and CLS.
Although now, the Chrome team and W3C have come up with a new standard: The Lighthouse Performance Score is a weighted average of these core web vitals standards.
PSI reports metrics over a 28-day period based on CrUX data.
@Author
Okay but how do they convert them …
To a score out of 100?
@Reader
Using a scoring curve that reflects real-world website performance data. (HTTPArchive data).
Two important points on this curve are:
25th Percentile. This represents average performance across websites. A metric value at this level translates to a score of 50.
8th Percentile. This represents good or better-than-average performance. A metric value at this level translates to a score of 90.
@Author
FAQs
•••
What matters for Website Speed?
We saw that the following are the most important when it comes to how your website performs. Hosting, Platform, Removing Junk Code, Optimizing Images and CDN.
Does Lighthouse consider server response times in its performance scoring?
Yes, Lighthouse measures metrics like Time to First Byte (TTFB), which reflects server response speed. Optimizing server response times can improve Lighthouse scores and overall website performance.
Do too many images slow down my site?
No, unoptimized images slow things down. Not too many of them.
Is it enough to optimize the front end only?
Slow database queries, inefficient server-side code (PHP, Python, etc.) and inadequate server resources (CPU, RAM) all contribute to “Time To First Byte” (TTFB).
And now over to you … Getting your website fast takes work! Start with find a good Litespeed host. And follow through with these steps to clean up your site. You’ll definitely see an improvement. Learn more about Website Optimization.