NVIDIA Stats: Report, Employees and Stock
Stats
3 Min-Read
Top NVIDIA Stats
- NVIDIA has a 90% GPU market share.
- There are over 29.6K NVIDIA employees.
- NVIDIA has more than 5,920 Female employees.
- NVIDIA has invested over $45.3B in R&D to date.
NVIDIA Market Share
What is AIB?
@Reader
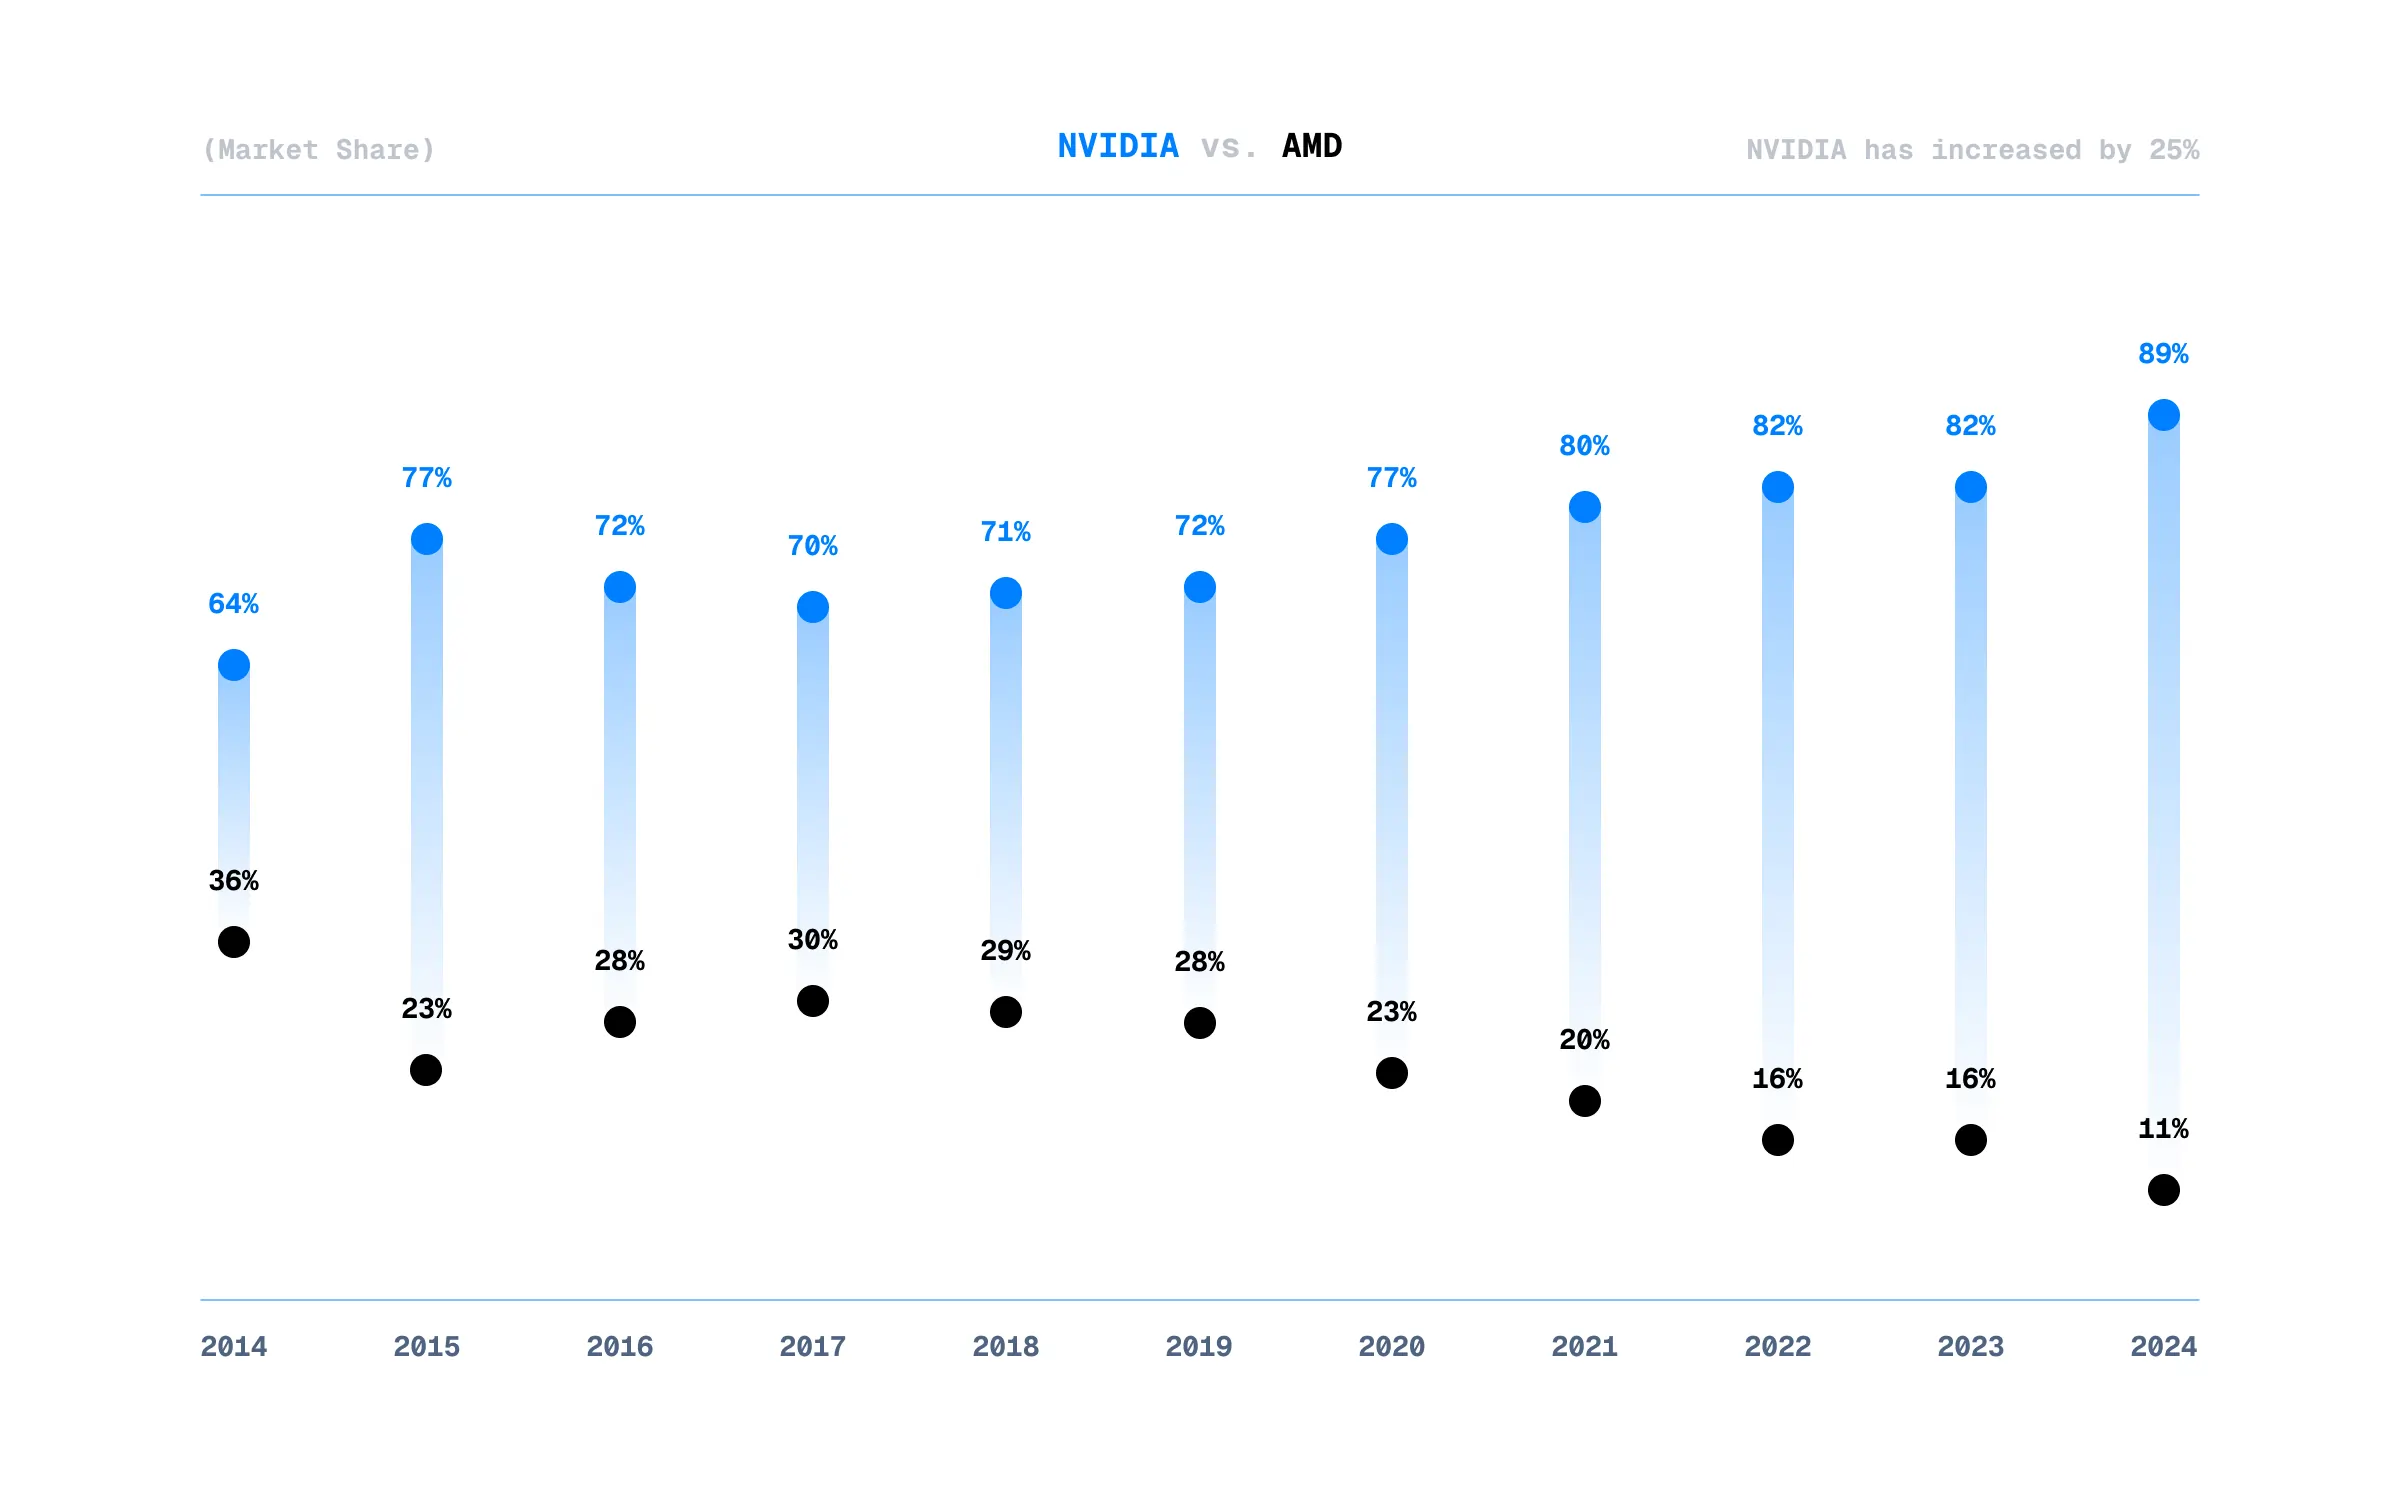
GPU Market Share by Quarter
| Quarter | Intel | AMD | NVIDIA |
|---|---|---|---|
| Q3-24 | 0% | 10% | 90% |
| Q2-24 | 0% | 12% | 88% |
| Q1-24 | 0% | 12% | 88% |
| Q4-23 | 1% | 19% | 80% |
| Q3-23 | 1% | 17% | 82% |
| Q2-23 | 3% | 17% | 80% |
| Q1-23 | 4% | 12% | 84% |
| Q4-22 | 2% | 12% | 86% |
| Q3-22 | 3% | 12% | 87% |
| Q2-22 | 1% | 20% | 79% |
| Q1-22 | 1% | 24% | 75% |
| Q4-21 | 0% | 22% | 78% |
| Q3-21 | 0% | 21% | 79% |
| Q2-21 | 0% | 20% | 80% |
| Q1-21 | 0% | 20% | 80% |
| Q4-20 | 0% | 17% | 83% |
| Q3-20 | 0% | 22% | 78% |
| Q2-20 | 0% | 22% | 78% |
| Q1-20 | 0% | 31% | 69% |
| Q4-19 | 0% | 31% | 69% |
| Q3-19 | 0% | 27% | 73% |
| Q2-19 | 0% | 32% | 68% |
| Q1-19 | 0% | 23% | 77% |
| Q4-18 | 0% | 19% | 81% |
| Q3-18 | 0% | 26% | 74% |
| Q2-18 | 1% | 34% | 65% |
| Q1-18 | 0% | 35% | 65% |
| Q4-17 | 0% | 34% | 66% |
| Q3-17 | 0% | 27% | 73% |
| Q2-17 | 0% | 29% | 71% |
| Q1-17 | 0% | 28% | 72% |
| Q4-16 | 0% | 30% | 70% |
| Q3-16 | 0% | 29% | 71% |
| Q2-16 | 0% | 30% | 70% |
| Q1-16 | 0% | 23% | 77% |
| Q4-15 | 0% | 30% | 70% |
| Q3-15 | 0% | 19% | 81% |
| Q2-15 | 0% | 18% | 82% |
| Q1-15 | 0% | 24% | 76% |
| Q4-14 | 0% | 35% | 65% |
| Q3-14 | 0% | 36% | 64% |
| Q2-14 | 0% | 38% | 62% |
| Q1-14 | 0% | 35% | 65% |
I see …
How about the total GPU market?
@Reader
(Sources: Statista & Jonpeddie)
How Many (Total) Employees Does NVIDIA Have Globally?
79% = Male, 20% = Female, 1% = Undeclared
NVIDIA Employees by Gender
| Year | N/A | Male | Female | Total |
|---|---|---|---|---|
| Average | 261 | 17,822 | 4,206 | 22,289 |
| 2024 | 296 | 23,384 | 5,920 | 29,600 |
| 2023 | 262 | 20,957 | 4,977 | 26,196 |
| 2022 | 225 | 17,978 | 4,270 | 22,473 |
| 2021 | 000 | 15,180 | 3,795 | 18,975 |
| 2020 | 000 | 11,709 | 2,066 | 13,775 |
NVIDIA Employees by Department
| Year | R&D | Other | TOR |
|---|---|---|---|
| 2024 | 75.0% | 25.0% | 2.7% |
| 2023 | 74.6% | 25.4% | 5.3% |
| 2022 | 72.3% | 27.7% | 4.9% |
| 2021 | 71.3% | 28.7% | 3.8% |
| 2020 | 71.2% | 28.8% | 3.5% |
TOR?
@Reader
| Year | Total | R&D | Other | YoY(%) |
|---|---|---|---|---|
| 2024 | 29.6K | 75.0% | 25.0% | +12.9% |
| 2023 | 26.2K | 74.6% | 25.4% | +16.6% |
| 2022 | 22.4K | 72.3% | 27.7% | +18.4% |
| 2021 | 18.9K | 71.3% | 28.7% | +37.7% |
| 2020 | 13.7K | 71.3% | 28.7% | +3.62% |
| 2019 | 13.3K | 71.4% | 28.6% | +15.2% |
| 2018 | 11.5K | 71.1% | 28.9% | +11.9% |
| 2017 | 10.3K | 70.7% | 29.3% | +11.6% |
| 2016 | 9.23K | 71.2% | 28.8% | -0.01% |
| 2015 | 9.23K | 72.1% | 27.9% | +4.77% |
| 2014 | 8.81K | 72.5% | 27.5% | +10.5% |
| 2013 | 7.97K | 72.5% | 27.5% | +11.8% |
| 2012 | 7.13K | 70.7% | 29.3% | +18.3% |
| 2011 | 6.03K | 69.0% | 31.0% | +5.66% |
| 2010 | 5.71K | 69.0% | 31.0% | +5.28% |
| 2009 | 5.42K | 69.6% | 30.4% | +8.73% |
| 2008 | 4.99K | 65.3% | 34.7% | +22.1% |
| 2007 | 4.08K | 65.3% | 34.7% | +49.2% |
| 2006 | 2.74K | 60.4% | 39.6% | +30.3% |
| 2005 | 2.10K | 58.6% | 41.4% | +15.1% |
| 2004 | 1.83K | 57.9% | 42.1% | +20.6% |
| 2003 | 1.51K | 54.9% | 45.1% | +34.7% |
| 2002 | 1.12K | 55.1% | 44.9% | +41.1% |
| 2001 | 796 | 57.5% | 42.5% | +103% |
| 2000 | 392 | 54.5% | 45.5% | +58.1% |
(Source: NVIDIA)
How Big Is NVIDIA
How much is a share of NVIDIA?
@Reader
How many NVIDIA shares exist?
@Reader
(Source: Companiesmarketcap)
How much of NVIDIA does Jensen Huang own?
@Reader
How much debt does NVIDIA have?
@Reader
How much of NVIDIA revenue is from China?
@Reader
(Source: NVIDIA)